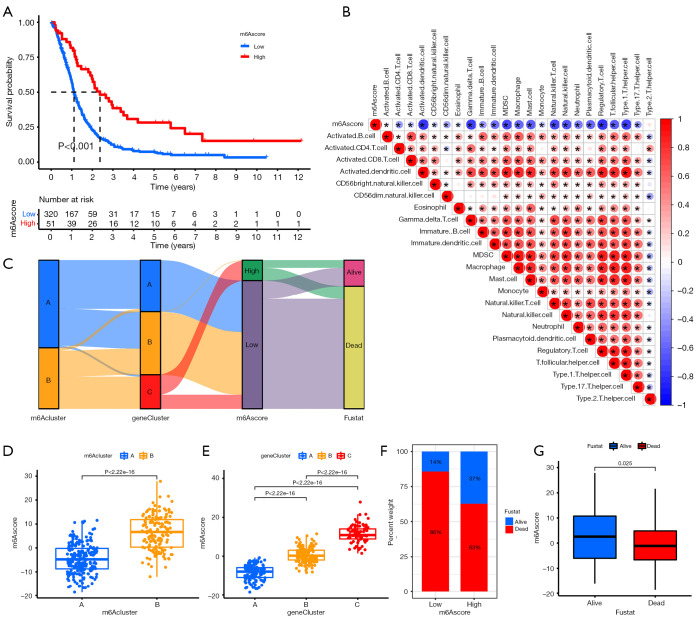
Figure 5.
Prognostic signature was related to immune cells and clinical prognosis. (A) Kaplan-Meier curves showing the overall survival probability between N6-methyladenosine (m6A) score groups. (B) Sankey diagram showing the association of m6A score groups with m6A clusters, gene clusters, and survival outcome. (C) Correlation analysis of m6A score and immune cells. (D) m6A score difference between gene cluster A, gene cluster B, and gene cluster C. (E) m6A score difference between m6A cluster A and m6A cluster B. (F,G) Association of m6A score with survival outcome.

