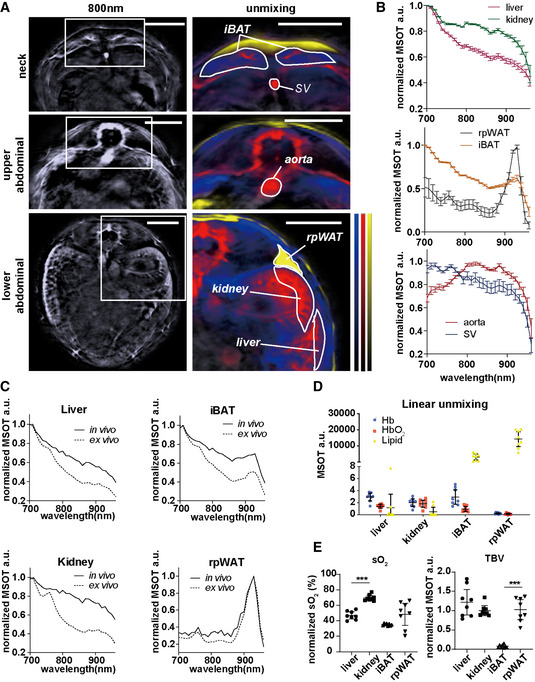
Figure 1. MSOT imaging of liver, kidney, interscapular brown adipose tissue (iBAT), retroperitoneal white adipose tissue (rpWAT), aorta and Sulzer vein (SV) from healthy mice in vivo and ex vivo .

-
AReconstructed MSOT images (800 nm) without and with linear unmixing data in the neck and the upper and lower abdominal areas, showing the ROIs for the liver, kidney, iBAT, rpWAT, aorta and SV. Unmixing result: blue for Hb, red for HbO2 and yellow for lipid. The colour bar shows the colour coding of MSOT a.u. from 0 to maximum (bottom to top) (maximum value neck/upper abdominal/lower abdominal: Hb: 2.5/3.5/0.9; HbO2:2.9/4.9/2.5; lipid: 24000/19000/13000). Scale bar: 4 mm.
-
BNormalized spectra of liver, kidney, iBAT, rpWAT, aorta and SV. Data represent the mean (± 95% confidence) from 8 animals (n = 8).
-
CNormalized spectra of liver, kidney, iBAT and rpWAT in vivo and ex vivo. The two spectra in each plot are from the same animal.
-
D, ELinear unmixing results from liver, kidney, iBAT and rpWAT. Each dot represents data from one animal, in total 8 animals (n = 8). Data represent the mean (± 95% confidence). The unpaired t‐test was used to verify the statistical significance. SO2 liver versus kidney: P = 1.66E‐07; TBV iBAT versus rpWAT: P = 5.58E‐07.
Data information: In the figure, A.U. = arbitrary units.
