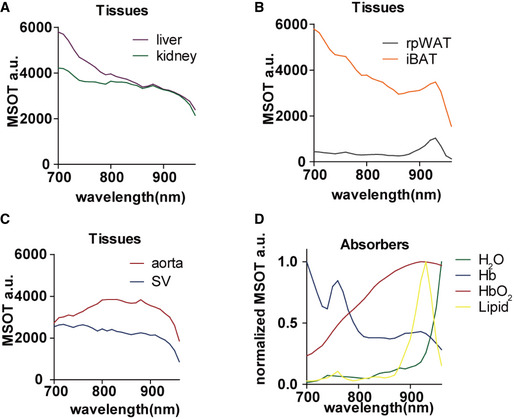
Figure EV1. MSOT spectra of liver, kidney, interscapular brown adipose tissue (iBAT), retroperitoneal white adipose tissue (rpWAT), aorta and Sulzer vein (SV) in vivo and main absorbers.

-
A–CRaw spectra of liver, kidney, iBAT, rpWAT aorta and SV in vivo. Data represent the mean from 8 animals (n = 8).
-
DNormalized spectra of H2O, Hb, HbO2 and Lipid. Data are provided as reference in ViewMSOT 3.8 software.
