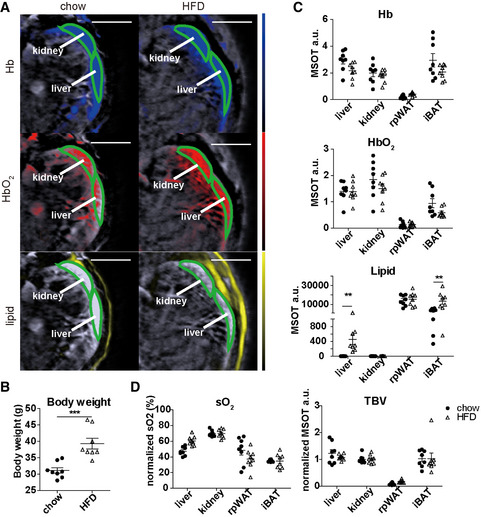
Figure 2. Comparison of oxygenation and lipid content of target tissues between healthy and obese mice using MSOT imaging.

- Reconstructed MSOT image (800 nm) with linear unmixing data of Hb, HbO2 and lipid from chow‐ and HFD‐fed mice. The colour bar shows the colour coding of MSOT a.u. from 0 to maximum (bottom to top) (maximum value chow/HFD: Hb: 1.3/0.6; HbO2: 1.8/0.9; lipid: 27000/27000). Scale bar: 4 mm.
- Body weight of chow‐ and HFD‐fed mice. Data represent the mean (± 95% confidence) from 8 animals (n = 8). The unpaired t‐test was used to verify the statistical significance. P = 0.0005.
- Unmixing result of Hb, HbO2 and lipid from liver, kidney, iBAT and rpWAT. Each dot represents data from one animal, in total 8 animals (n = 8). Data represent the mean (± 95% confidence). The unpaired t‐test was used to verify the statistical significance. Lipid chow versus HFD liver: P = 0.3339; iBAT: P = 0.0068.
- Tissue oxygenation (sO2) and total blood volume (TBV) results from liver, kidney, iBAT and rpWAT. Each dot represents data from one animal, in total 8 animals (n = 8). Data represent the mean (± 95% confidence). The unpaired t‐test was used to verify the statistical significance.
Data information: In the figure, A.U. = arbitrary units.
