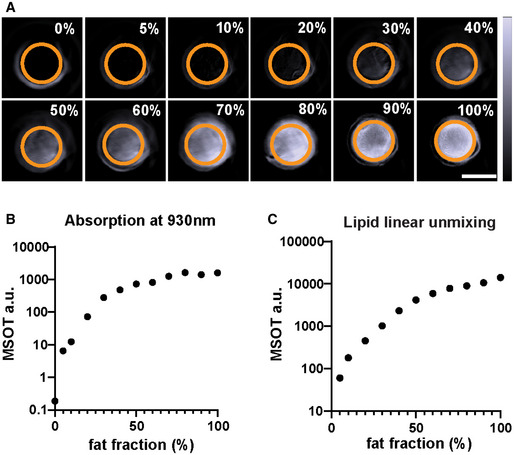
Figure EV2. MSOT imaging of lipid phantoms.

- Reconstructed MSOT images (930 nm) of phantoms containing 0–100% lipid. The lipid fraction and the ROI are indicated on each image. The colour bar shows the colour coding of MSOT a.u. from 0 to 2,000 a.u. (bottom to top). Scale bar: 4 mm.
- Absorption of lipid phantoms at 930 nm. Data represent the mean from 3 sections per phantom.
- Linear unmixing result of lipid from the phantoms. Data represent the mean from 3 sections per phantom.
