
Figure 3. MSOT detection of lipid content in healthy and steatotic livers in vivo and ex vivo .
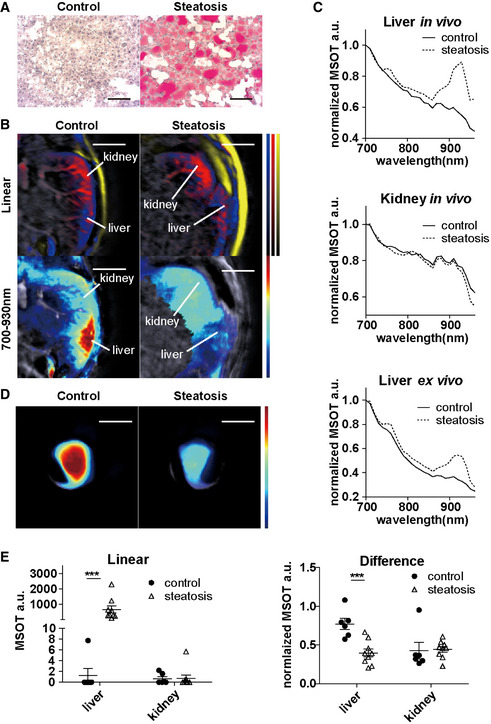
- Oil Red O staining of control (healthy) and steatotic liver. Scale bar: 100 µm.
- Reconstructed MSOT image (800 nm) with linear unmixing and difference value of lipid in lower abdominal section. Unmixing result: blue for Hb, red for HbO2, yellow for lipid and jet for 700–930 nm difference. The colour bar shows the colour coding of MSOT a.u. from 0 to maximum (bottom to top) (maximum value control/steatosis: Hb: 1.1/0.5; HbO2: 1.9/0.8; lipid: 21,000/24,000; 700–900 nm: 3,000/3,000). Scale bar: 4 mm.
- Normalized spectra of livers and kidneys from a control (healthy) and a subject with hepatic steatosis. Each spectrum is from the same animal.
- Reconstructed MSOT image (800 nm) with difference values of lipid in control (healthy) and steatotic liver ex vivo. The colour bar shows the colour coding of MSOT a.u. from 0 to maximum (bottom to top) (maximum value control/steatosis: 10,000/10,000). Scale bar: 4 mm.Data in panel A–D are from the same subjects.
- Linear unmixing readouts of lipids and difference values from control and steatotic (grade 3) livers. Control: n = 6, steatosis: n = 9. Each dot represents data from one animal (control: n = 6, steatosis: n = 9). Data represent the mean (± 95% confidence). The Mann–Whitney test and the unpaired t‐test were used to verify the statistical significance in linear and difference data, respectively. Linear liver control versus steatosis: P = 0.0004; difference liver control versus steatosis: P = 6.62E‐06.
Data information: In the figure, A.U. = arbitrary units.