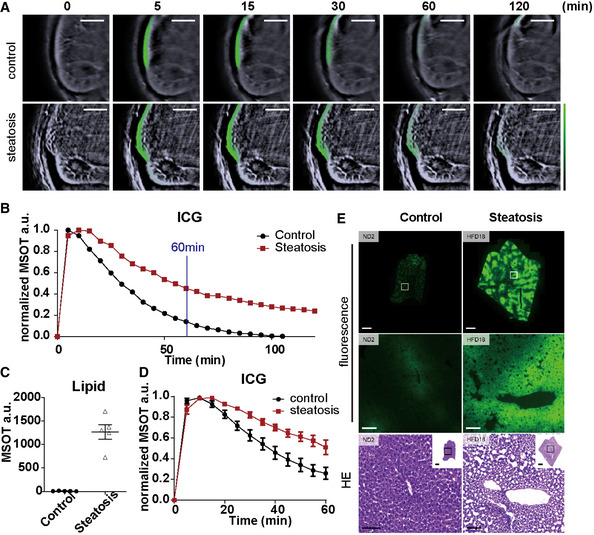
Figure 5. MSOT imaging of ICG clearance in mouse livers.

- Reconstructed MSOT image (800 nm) with linear unmixing data of ICG from mice with and without steatosis. The colour bar shows the colour coding of MSOT a.u. from 0 to maximum (bottom to top) (maximum value control/steatosis: 0.07/0.02). Scale bar: 4 mm.
- Normalized spectra of control and steatotic liver 10 and 120 min after ICG injection. Each line represents data from one animal. Each data point is from a single measurement of each animal at each time point.
- Quantification of linear unmixing of lipid in livers with and without steatosis. Each dot represents data from one animal (n = 5). Data represent the mean (± 95% confidence).
- Longitudinal monitoring of ICG intensity in control and steatotic livers (time interval: 5 min; total length: 60 min). Each data point represents the mean from 5 animals at each time point. For each curve, data are normalized to the highest intensity acquired.
- Representative fluorescence microscopy and HE staining images of control and steatotic liver. Scale bar: 100 µm.
Data information: In the figure, A.U. = arbitrary units.
