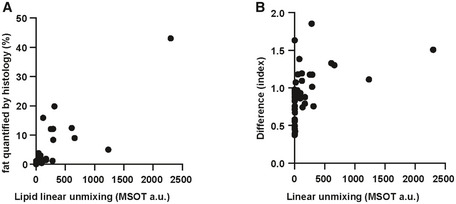
Figure EV5. Correlation analysis of different lipid detection methods.

- Correlation between lipid linear unmixing readout and fat quantification by histology. Each dot represents data from one animal (n = 41).
- Correlation between lipid linear unmixing readout and difference analysis readout. Each dot represents data from one animal (n = 41).
