
Figure 7. Atorvastatin prevented ACM phenotype in HFD‐fed Pkp2+/− mice.
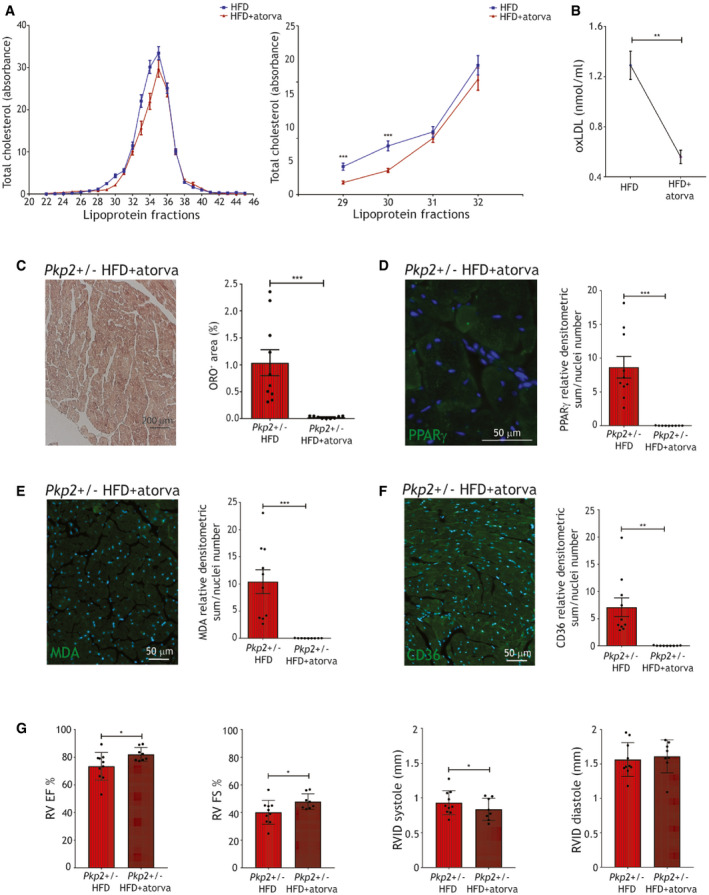
- Left panel: plasma total cholesterol in the different lipoprotein fractions of WT and Pkp2+/− mice fed a 3‐month HFD (blue line) or a 3‐month HFD+atorvastatin (red line). Right panel: plasma total cholesterol quantity in fractions 29–32, corresponding to low‐, very‐low‐, and intermediate‐density lipoproteins, of WT and Pkp2+/− mice fed a 3‐month HFD (blue line; n = 7) or a 3‐month HFD+atorvastatin (red line; n = 9; two‐tailed Student’s t‐test).
- oxLDL plasma concentration in WT and Pkp2+/− mouse samples, fed a 3‐month HFD plus atorvastatin (n = 8), compared to HFD (as in Fig 6B; two‐tailed Student’s t‐test).
- Left panel: representative images of ORO staining of cardiac sections of Pkp2+/− mice, fed a 3‐month HFD plus atorvastatin. Right panel: quantification of the percentage of ORO positive area (n = 9) is compared to that in HFD (as in Fig 6C; two‐tailed Student’s t‐test).
- Representative images of PPARγ immunostaining (green) on cardiac sections of Pkp2+/− mice fed a 3‐month HFD plus atorvastatin (n = 9). Quantification is compared to the values of Pkp2+/− in HFD and relative to WT in CD (as in Fig 6D; two‐tailed Student’s t‐test).
- Representative images of MDA immunostaining (green) on cardiac sections of Pkp2+/− mice fed a 3‐month HFD plus atorvastatin (n = 9). Quantification is compared to the values of Pkp2+/− in HFD and relative to WT in CD (as in Fig 6E; two‐tailed Student’s t‐test).
- Representative images of CD36 immunostaining (green) on cardiac sections of Pkp2+/− mice fed a 3‐month HFD plus atorvastatin (n = 9). Quantification is compared to the values of Pkp2+/− HFD and relative to WT in CD (as in Fig 6F; two‐tailed Student’s t‐test). Nuclei are counterstained with Hoechst33342 (blue).
- RV EF and FS percentages, RVID in systole and diastole of Pkp2+/− mice during (left panel) and after (right panel) 3‐month HFD plus atorvastatin feeding (n = 9). For comparison, RV EF of Pkp2+/− mice fed a HFD is shown (as in Fig 6G; two‐tailed Student’s t‐test).
Data information: mean ± SEM. *P < 0.05; **P < 0.01; and ***P < 0.001.
Source data are available online for this figure.