Figure 6.
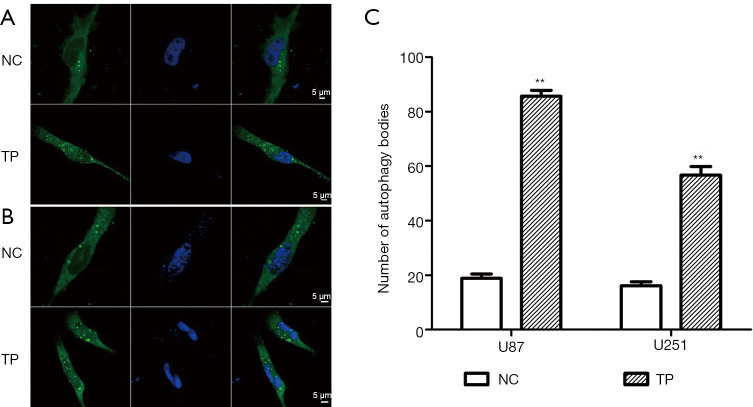
Cellular immunofluorescence detection of autophagic changes in glioma cells under stimulation with TP. (A) Cellular immunofluorescence results show that the number of autophagosomes increased significantly after TP was applied to U87 cells. (B) Cellular immunofluorescence results show that the number of autophagosomes increased significantly after TP was applied to U251 cells. (C) Statistical data of the number of autophagosomes after TP stimulation of U87 and U251 cells. ** represents P<0.01. NC normal control; TP, triptolide.

