
Figure 3: Predictive model details.
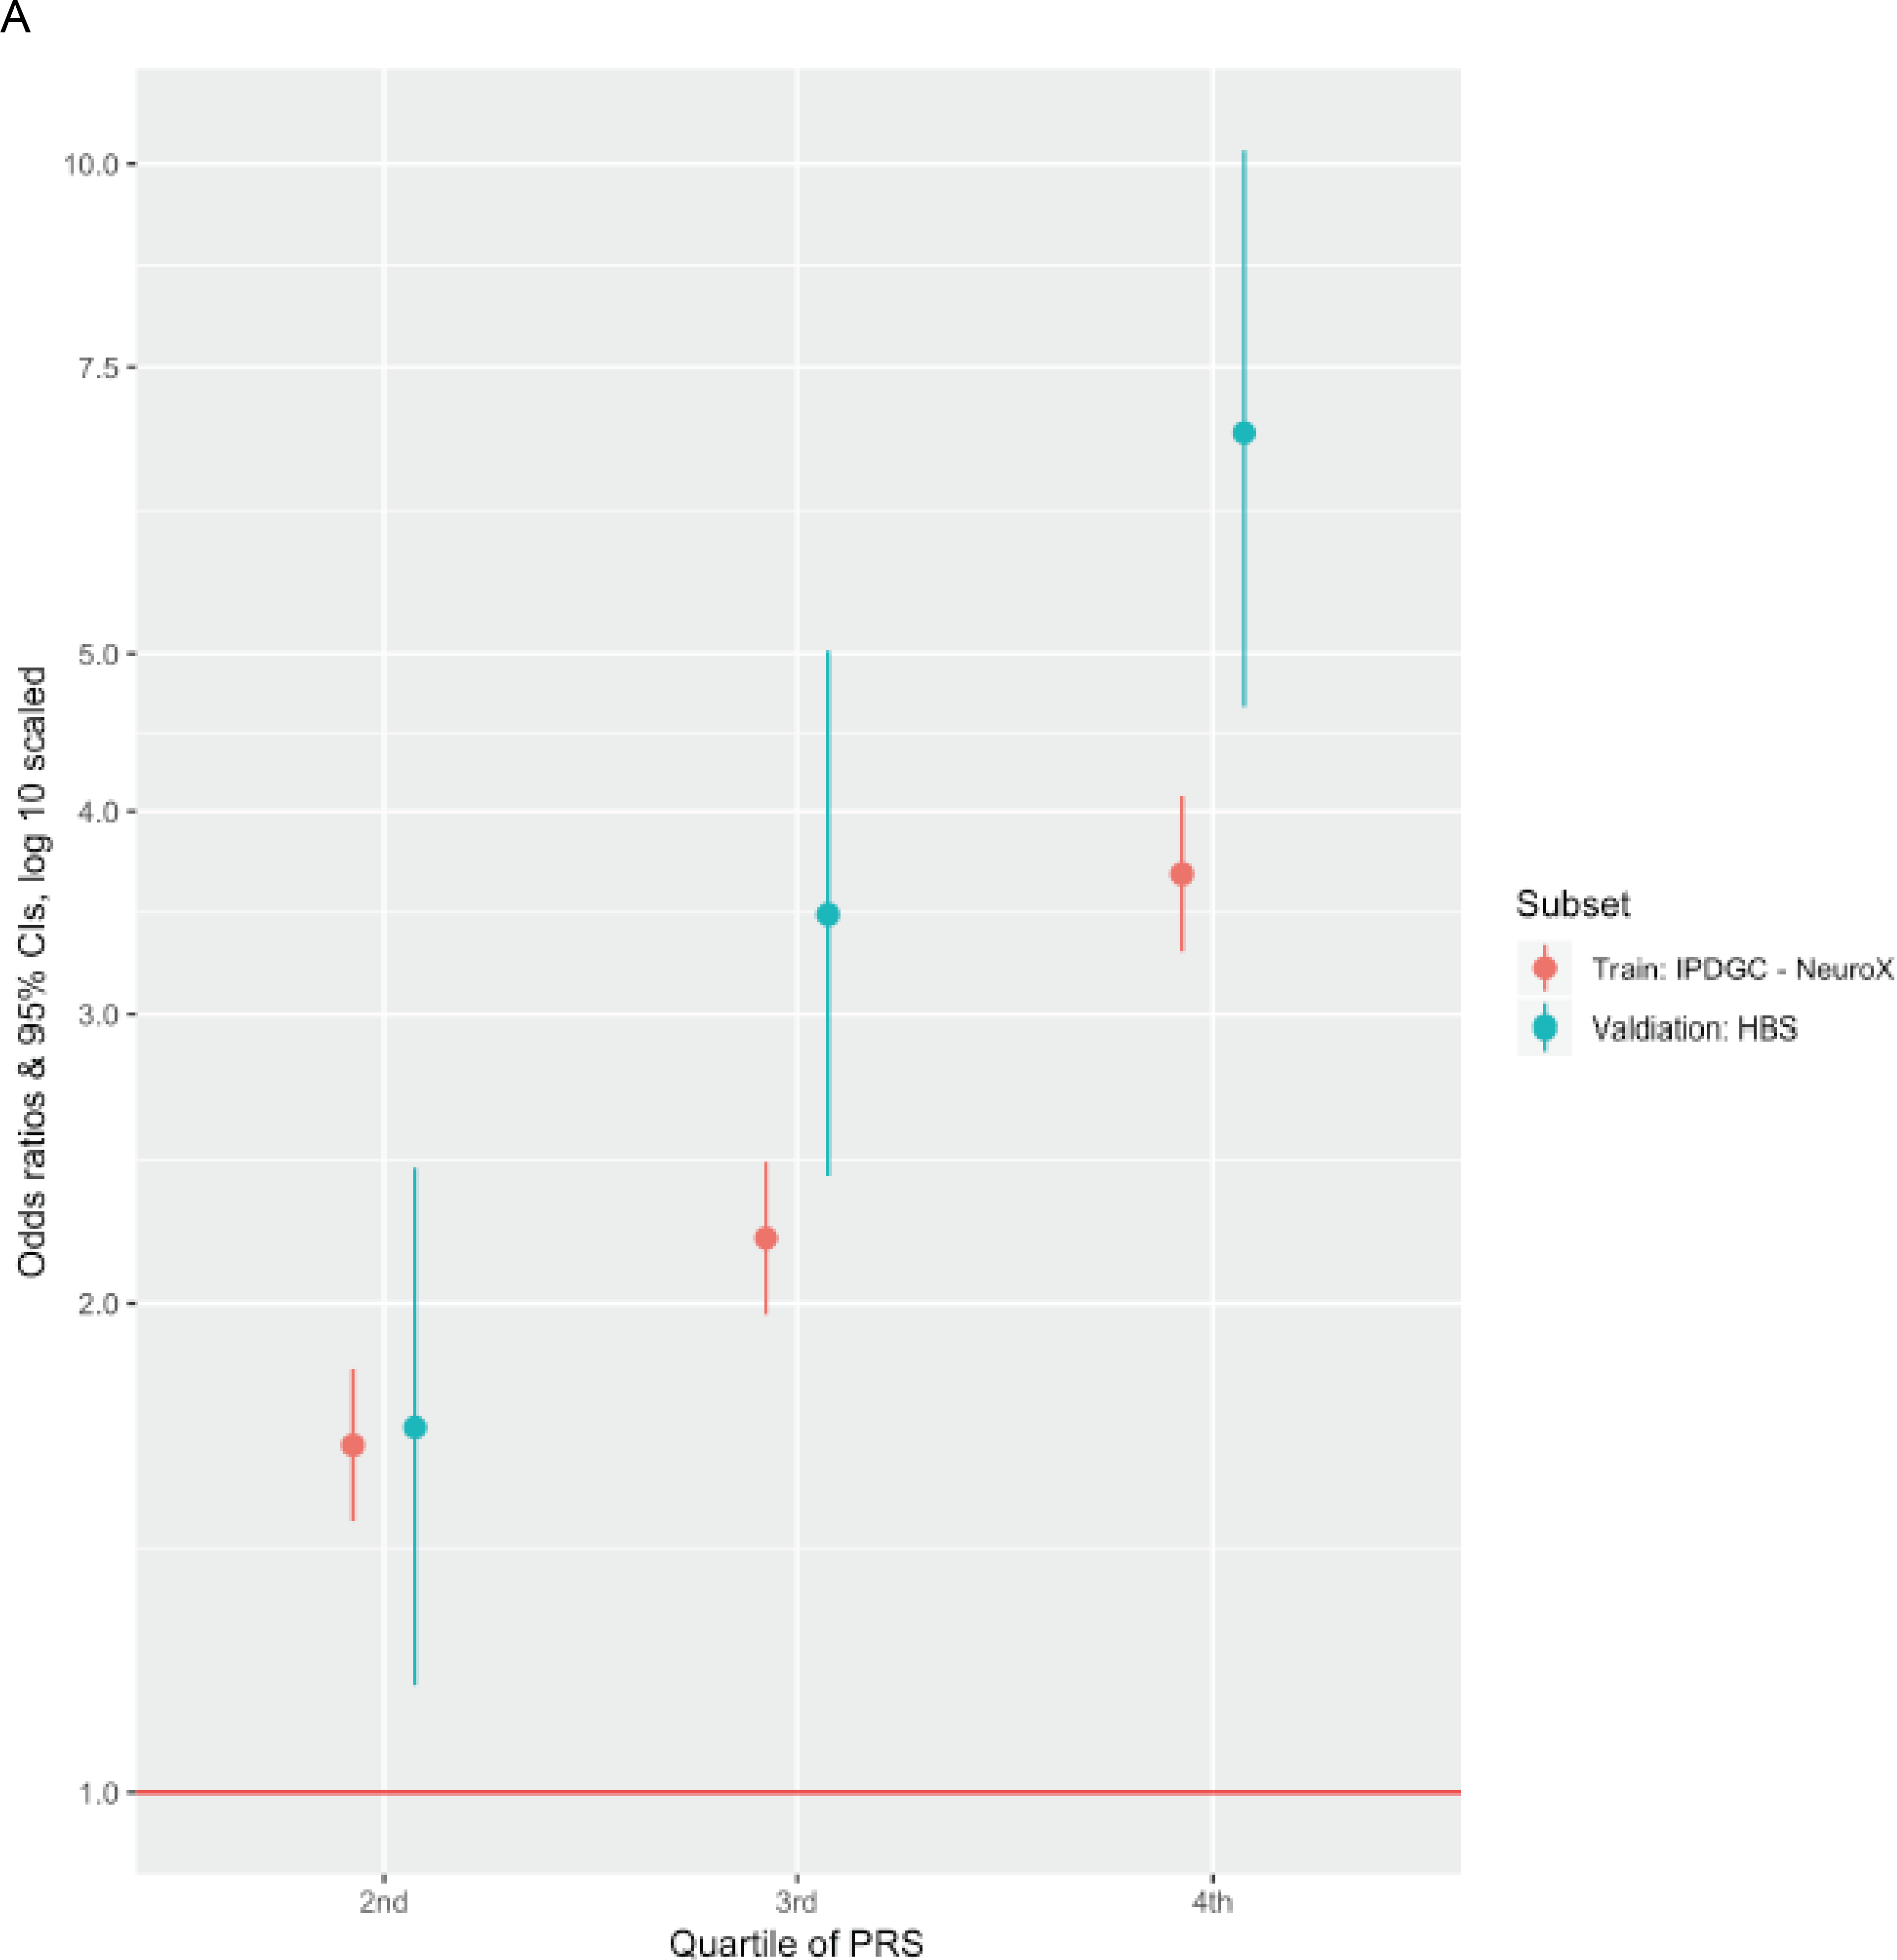
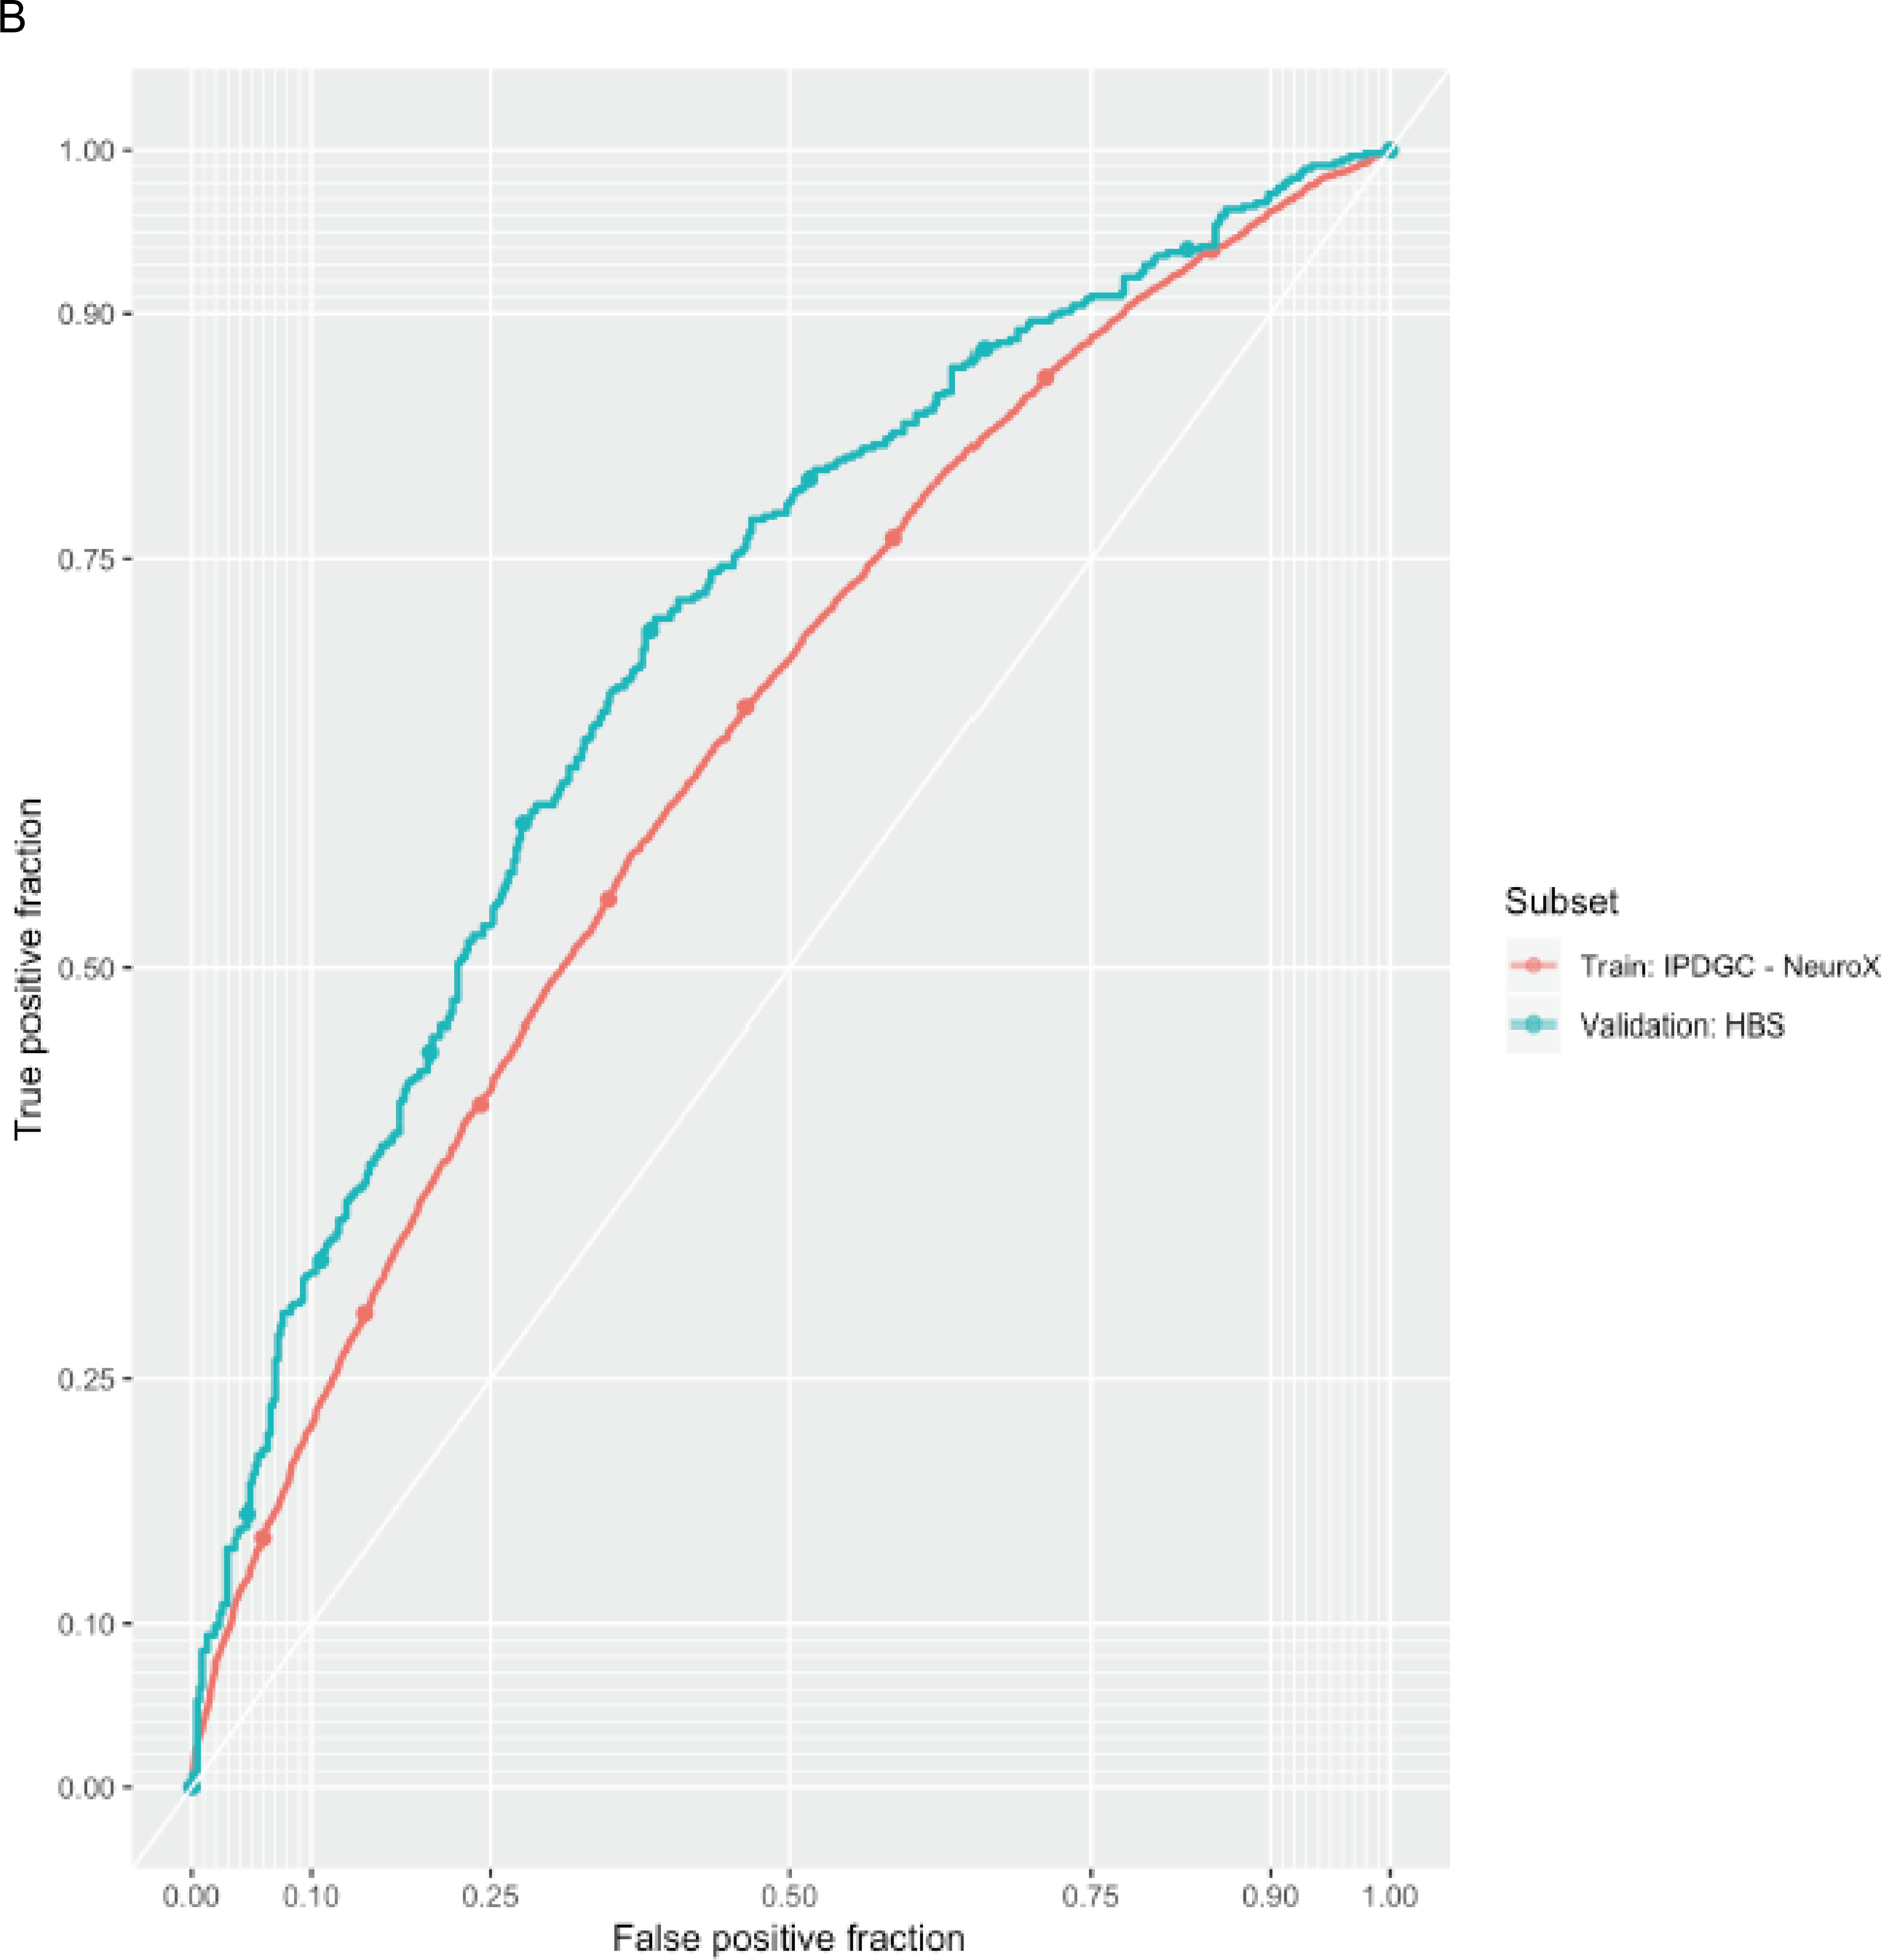
A. The odds ratio of developing PD for each quartile of polygenic risk score (PRS) compared to the lowest quartile of genetic risk. B. PRS receiver-operator curves for the more inclusive 1805 variant PRS in the validation dataset as well as in the corresponding training dataset that was used for PRS thresholding and SNP selection.