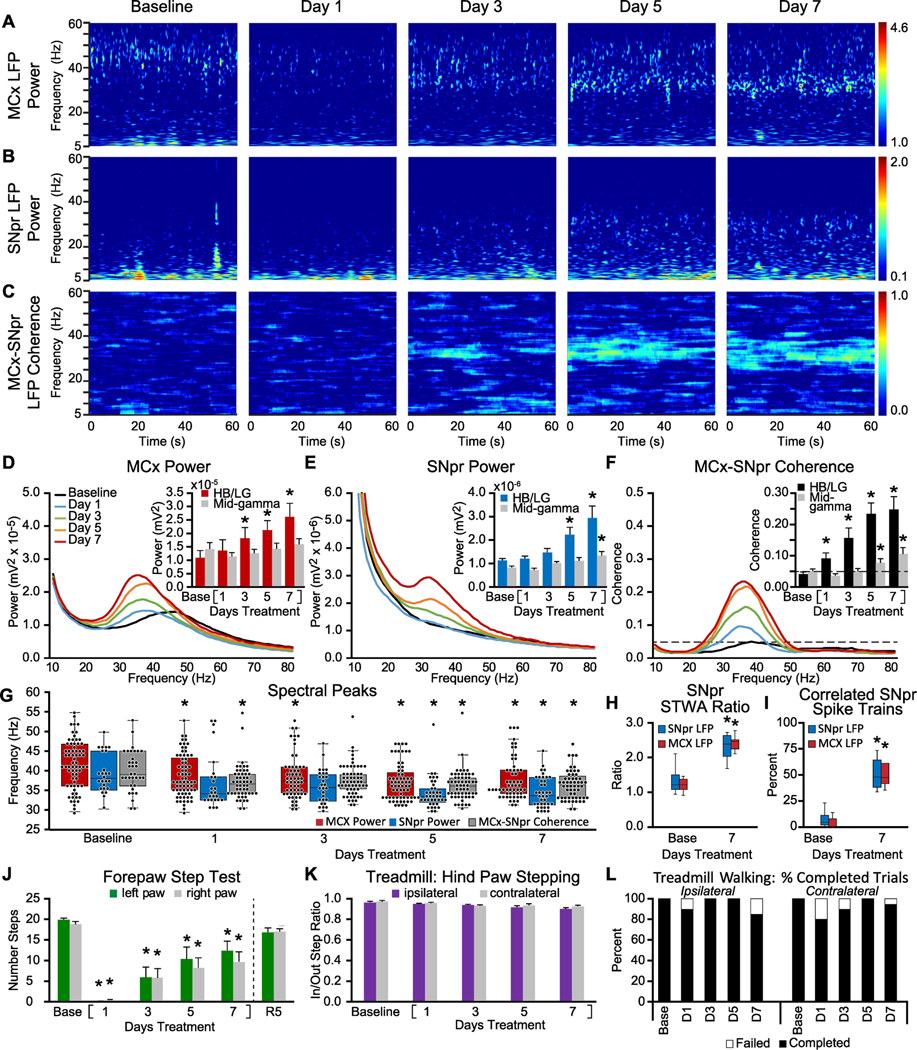
Figure 3: Alterations in MCx and SNpr HB/LG LFP activity, spike-LFP relationships and motor performance over one week of chronic treatment with dopamine receptor D1 and D2 antagonists.
A-C: Representative time-frequency wavelet scalograms of spectral power in LFP recordings from MCx and SNpr, and FFT-based time-frequency MCx-SNpr coherence during treadmill walking. Recordings were obtained prior to (Baseline/Base) and over one week of chronic, twice-daily treatment with D1+D2 antagonists on days 1, 3, 5 and 7 at 10 AM and 5 PM, prior to the first treatment of D1+D2 antagonists. Power is plotted on a logarithmic scale and coherence spectrograms are plotted on a linear scale with greater values represented by red. D-F: Averaged MCx and SNpr LFP power spectra and MCx-SNpr coherence spectra with bar graphs (inset) depicting mean total LFP power around dominant peaks in the HB/LG frequency range in the MCx (D, red bars), SNpr (E, blue bars) and MCx-SNpr coherence (F, black bars), and in the mid-gamma range (D-F grey bars). Bar graphs depict linear increases in HB/LG LFP power over days 1, 3, 5 and 7 of treatment in MCx (R2 = 0.90) and SNpr (R2 = 0.94) and HB/LG MCx-SNpr coherence (R2 = 0.95). * p < 0.05, relative to baseline (Base). G: Dominant peaks in MCx and SNpr LFP power and coherence spectra. Box plots show median and 25th to 75th percentile values as well as individual peak frequencies (black dots) for dominant peaks in MCx and SNpr power and MCx-SNpr coherence at baseline and on days 1, 3, 5 and 7 following chronic treatment with D1+D2 antagonists. * p < 0.05, relative to baseline, max n = 120 peaks, 15 rat hemispheres, see methods. H-I: Spike-LFP phase-locking of spikes from SNpr multiunit spike-trains with HB/LG SNpr and MCx LFP activity at baseline and at day 7 of chronic DA antagonist treatment. H: Box plots show unshuffled:shuffled peak-to-trough STWA ratios of SNpr spike trains correlated to SNpr LFPs or to MCx LFPs. I: Box plots show proportion of multiunit SNpr spike trains with spikes significantly correlated to SNpr and MCx LFPs. * p < 0.05, relative to baseline, n = 144 multiunit spike trains, 2 epochs/train, 4–8 trains per rat, 10 hemispheres). JL: Motor function at baseline and following chronic treatment with D1+D2 antagonists. J: Bar graphs show the number of steps made by the right paw and left paws in forelimb step test at baseline and at days 1, 3, 5 and 7 and after a 5 day recovery without antagonist treatment (R5). K: Bar graph displays inner:outer hind limb step count ratios during ipsilateral (purple bars) and contralateral (gray bars) walking on the circular treadmill at baseline and over days 1, 3, 5 and 7. L: Bar graph indicates the % completed trials (black bars) vs incidences of failure (white bars) to initiate and maintain steady treadmill walking for at least 30 seconds when oriented in the direction contralateral to the lesion. * p < 0.05, relative to baseline

