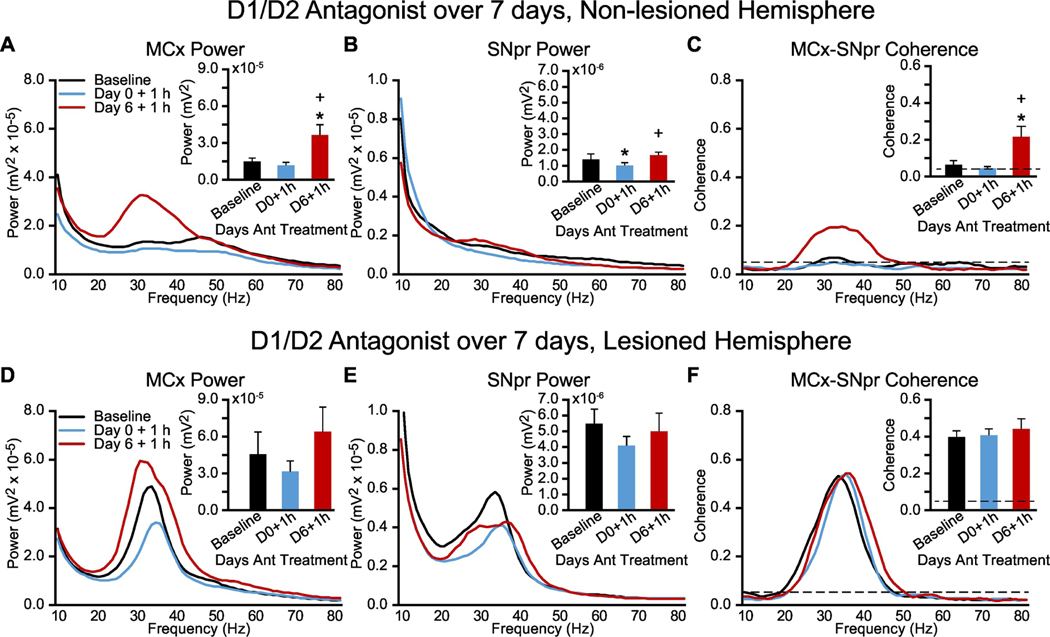
Figure 4: Alterations in MCx and SNpr HB/LG LFP activity in lesioned and non-lesioned hemispheres of unilaterally DA-cell-lesioned rats over one week of chronic treatment with dopamine receptor D1 and D2 antagonists.
Recordings were obtained during treadmill walking before commencement of chronic drug treatment (Baseline) and 1 hour after drug administration on the first (Day 0 + 1 h) and seventh (Day 6 + 1 h) days of chronic antagonist treatment during periods of catalepsy (with manually induced movement, see methods). A-C, Non-lesioned hemisphere: Averaged MCx LFP power spectra (A) and SNpr LFP power spectra (B) and MCx-SNpr coherence spectra (C) with bar graphs (inset) depicting mean total LFP power or coherence around dominant peaks in the HB/LG frequency range at Baseline (black bars), on the first day of treatment (Day 0 + 1 h, blue bars) and on the seventh day of treatment (Day 6 + 1 h, red bars). D-F, Lesioned hemisphere: Averaged MCx LFP power spectra (D) and SNpr LFP power spectra (E) and MCx-SNpr coherence spectra (F) with bar graphs (inset) depicting mean total LFP power or coherence around dominant peaks in the HB/LG frequency range at Baseline (black bars), on the first day of treatment (Day 0 + 1 h, blue bars) and on the seventh day of treatment (Day 6 + 1 h, red bars). * p < 0.05, relative to baseline.

