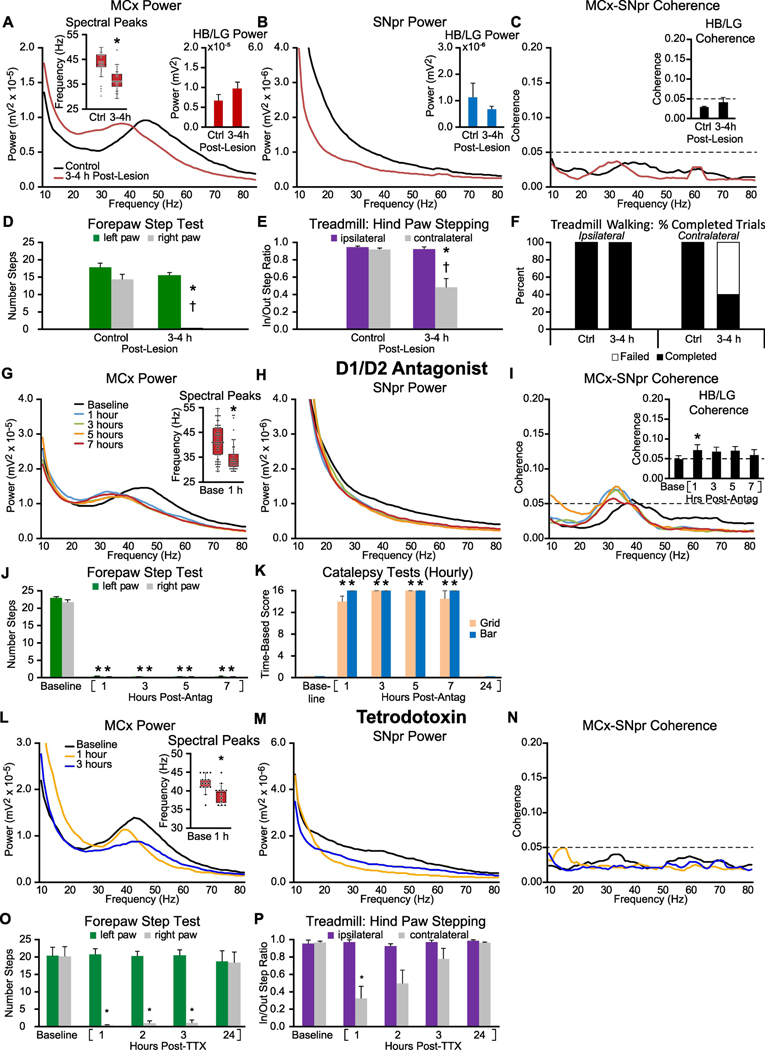
Figure 5: Early alterations in MCx and SNpr high beta/low gamma LFP activity and motor performance in the hours following either unilateral 6-OHDA induced dopamine cell lesion (A-F), single administration of D1+D2 antagonists (G-K), or MFB infusion of TTX (L-P).
A-C: Averaged MCx and SNpr LFP power spectra and MCx-SNpr coherence spectra before (Ctrl) and 3–4 hours after unilateral DA-cell lesion during epochs of treadmill walking. Bar graphs (inset) depict mean total LFP power around dominant peaks in the HB/LG frequency range in the MCx (A, red bars), SNpr (B, blue bars) and MCx-SNpr coherence (C, black bars). Box plot inset in A depicts median peak frequencies of dominant peaks before and after lesion. * p < 0.05, relative to control (Ctrl). D-F: Motor function in control rats and 3–4 h following unilateral DA cell lesion. D: Bar graph shows the number of steps made by the right paw and the left paw in the forelimb step test in control and post-lesion. E: Bar graph displays inner:outer hind limb step count ratios during ipsilateral (purple bars) and contralateral (gray bars) walking in a circular treadmill. F: Bar graph indicates the % completed trials (black bars) vs incidences of failure (white bars) to initiate and maintain steady treadmill walking for at least 30 seconds when oriented in the direction contralateral to the lesion. * p < 0.05, relative to control, † p < 0.05, contralateral vs. ipsilateral G-I: Averaged LFP power and MCx-SNpr coherence spectra at baseline (Base) and over 7 hours following treatment with D1+D2 antagonists. Box plot inset in G depicts median peak frequencies of dominant peaks before and 1 hour following treatment. Bar graph inset in I depicts mean MCx-SNpr coherence (black bars). J-K: Motor function at baseline and over 7 hours following D1+D2 antagonist treatment. J: Bar graphs show the number of steps made by the right paw and left paws in forelimb step test at baseline and at hours 1, 3, 5 and 7 following the first dose. K: Bar graph depicts assessments of catalepsy as measured by grid (beige) and bar (blue) tests. * p < 0.05, relative to baseline. L-N: Averaged LFP power and MCx-SNpr coherence spectra during treadmill walking at baseline and over 24 hours following infusion of TTX. Box plot inset in L depicts median peak frequencies of dominant peaks before and 1 hour following infusion. * p < 0.05, relative to baseline. O-P: Motor function before and following infusion of TTX. O: Bar graphs show the number of steps made by the right paw and left paws in forelimb step test at baseline and at hours 1, 2, 3, and 24 following treatment. P: Bar graph displays inner:outer hind limb step count ratios during ipsilateral (purple bars) and contralateral (gray bars) walking on the circular treadmill at baseline and over hours 1, 2, 3, and 24. * p < 0.05, relative to baseline.

