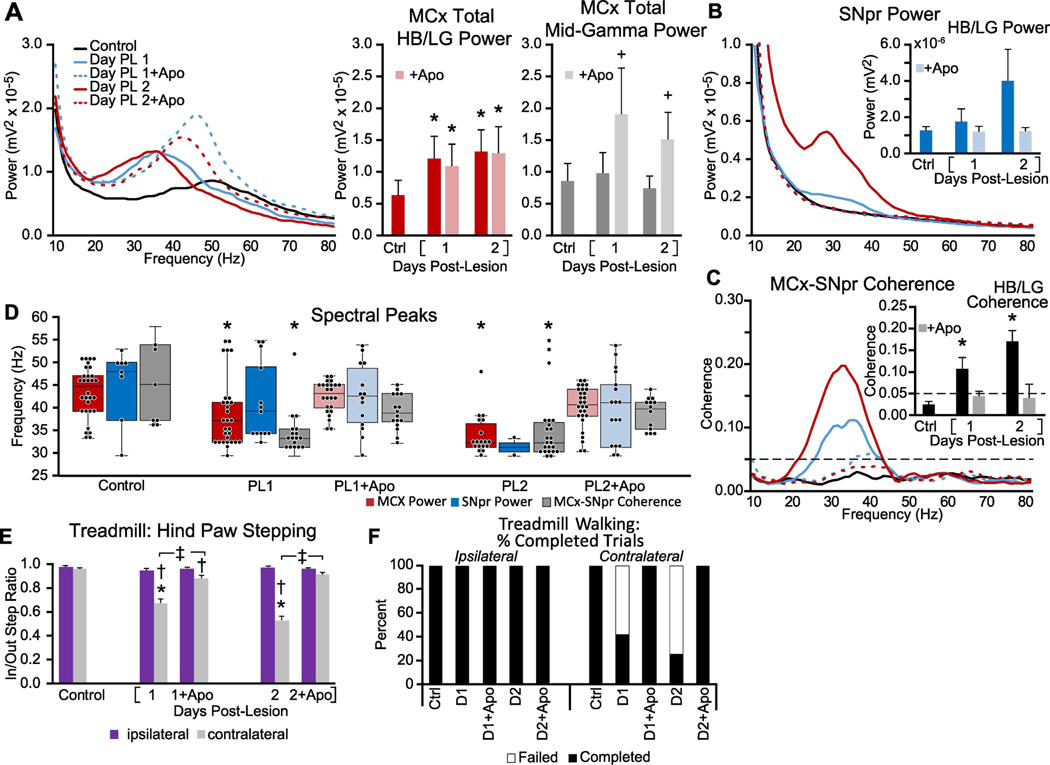
Figure 6: Acute effects of apomorphine-induced stimulation of dopamine receptors on MCx and SNpr high beta/low gamma LFP activity and motor performance on days 1 and 2 after unilateral 6-OHDA-induced DA cell loss.
A-C: Averaged MCx and SNpr LFP power spectra and MCx-SNpr coherence spectra with bar graphs (inset in B, C) depicting mean total LFP power around dominant peaks in the HB/LG frequency range in the MCx (A, red bars), SNpr (B, blue bars), and MCx-SNpr coherence (C, black bars) during treadmill walking in control (Ctrl), at 24 h and 48 h after DA cell lesion (Day PL 1 and Day PL 2, respectively) and following systemic injection of apomorphine (Day PL 1 + Apo and Day PL 2 + Apo, represented by lighter bars). * p < 0.05, relative to control, + p < 0.05, relative to pre-apomorphine. D: Distribution of the frequencies of dominant spectral peaks in MCx and SNpr LFP power and MCx-SNpr coherence spectra in recordings during treadmill walking in control, at Day PL 1 and Day PL 2, and following systemic injection of apomorphine. Box plots depict 25th to 75th percentile values and black dots show individual peak frequencies. *p < 0.05, relative to control, n = 6 rats, max 8 peaks per rat, see methods). E-F: Motor function in control rats and following DA-cell lesion with and without apomorphine. E: Bar graph displays inner:outer hind limb step count ratios during ipsilateral (purple bars) and contralateral (gray bars) walking in a circular treadmill. F: Bar graph indicates the % completed trials (black bars) vs incidences of failure (white bars) to initiate and maintain steady treadmill walking for at least 30 seconds when oriented in the direction contralateral to the lesion. * p < 0.05, relative to control, † p < 0.05, contralateral vs. 1343versive, ‡ p < 0.05, Day 1 + Apo vs. Day 2 + Apo

