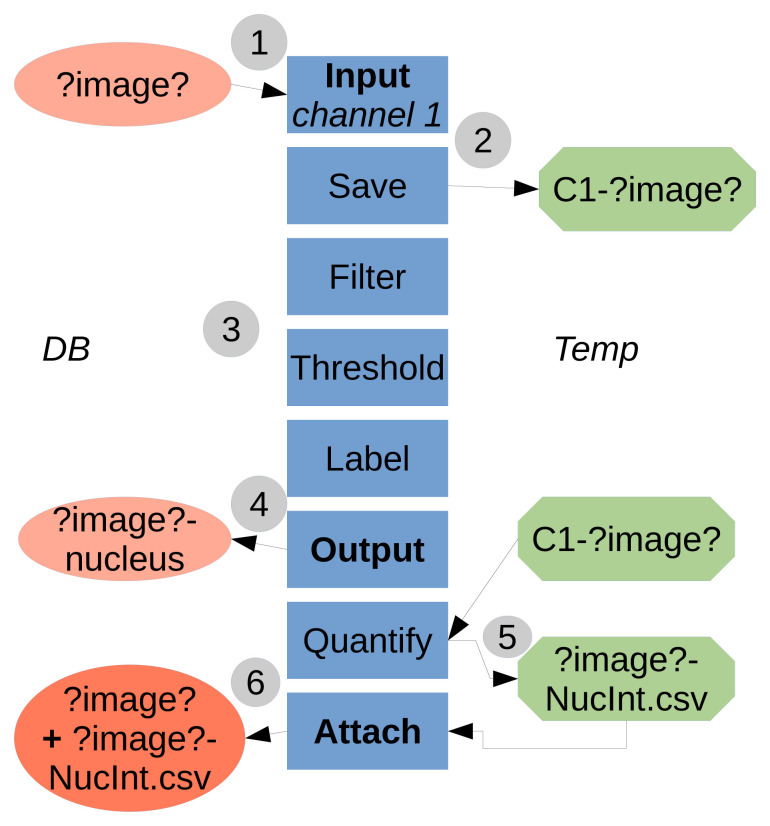
Figure 1. Flowchart of the TAPAS system.
1) The data to be processed is input into the processing pipeline from the Database (either OMERO or local). ?image? is a keyword used to refer to the image name. The names in boxes refer to the module names. 2) The necessary data to be used later is saved locally, in a temporary folder (home folder, ImageJ/Fiji folder or system temporary folder). Here we saved the raw data for channel 1. 3) The data is processed, here a classical pipeline consisting of filtering, thresholding and labelling. 4) The resulting labelled data is output to the Database, here the labelled structure for channel 1 is the nucleus. 5) The previously saved raw data is used as parameter to quantify intensity inside the labelled nuclei. The results table is saved first in a file locally. 6) The results table file is then attached to the original processed image. The temporary saved data (raw data for channel 1 and results table file) can be then deleted within the pipeline or manually.

