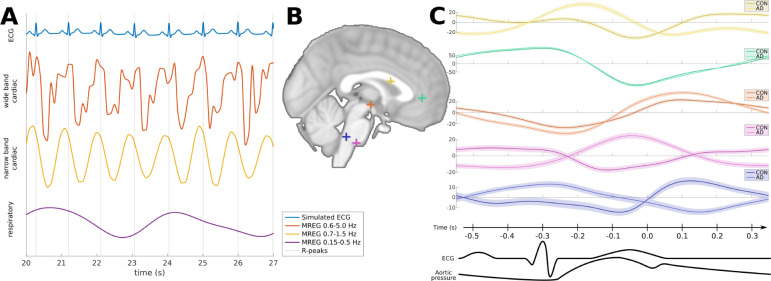
Figure 2.
Examples of the MREG signal shape. (A) Physiological MREG signals at the ACA in QRS synchronization with simulated ECG plots. From top to bottom: simulated ECG signal matching measured QRS timing, wide band cardiac MREG signal used in this study (0.6–5.0 Hz), narrow band MREG cardiac signal (0.7–1.5 Hz), and respiratory MREG signal (0.15–0.5 Hz). Vertical axes are in arbitrary units, and only MREG signals are comparable. (B) Cardiovascular MREG signal examples of the 0.9 s cardiac cycle used in this work at several representative locations in the brain midline. Average signals are separately shown for control and Alzheimer’s disease group with 95% CI in the background. Vertical axes are MREG signals in arbitrary units.

