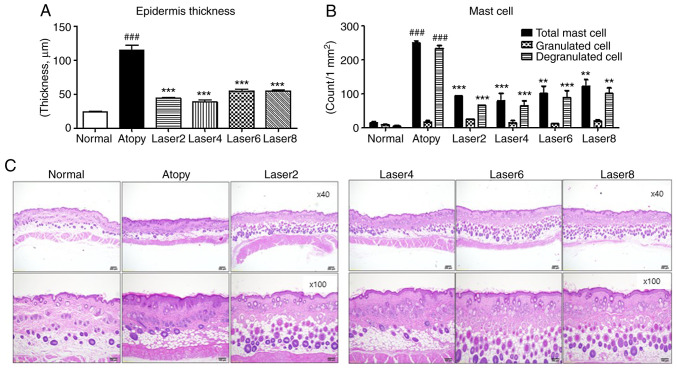
Figure 4.
Effects of LLLT on skin tissue. (A) Changes in epidermal thickness. (B) Number of mast cells in the tissue. (C) Histopathological analyses of mast cells and tissues (magnification, x40 x100). Normal: Normal control group; Atopy: Only induced atopic dermatitis; Laser2 at 2 J/cm2 (n=10); Laser4 at 4 J/cm2 (n=10); Laser6 at 6 J/cm2 (n=9); and Laser8 at 8 J/cm2 (n=10). **P<0.01, ***P<0.001 vs. Atopy; ###P<0.001 vs. Normal.

