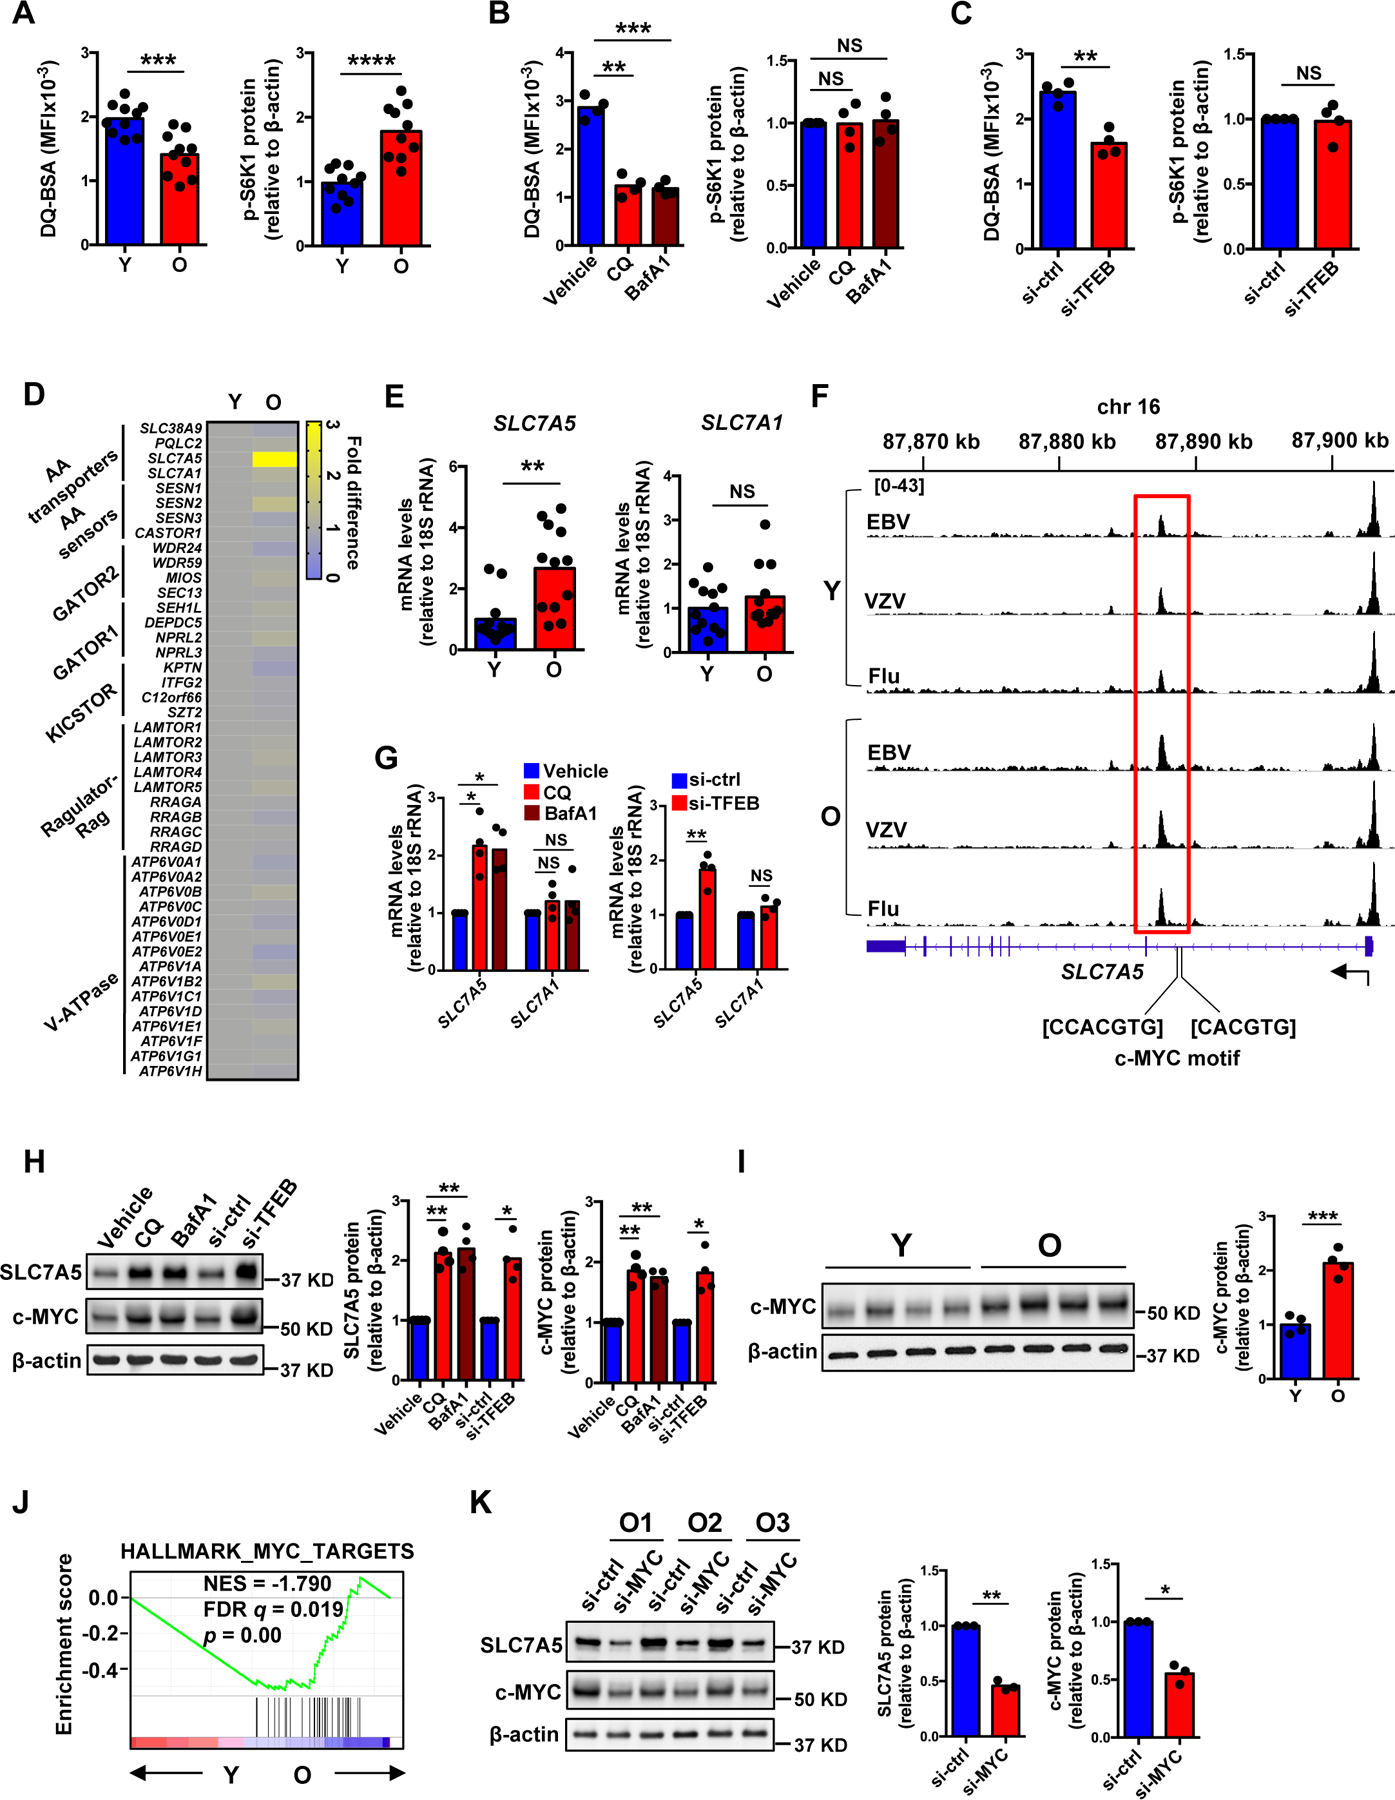
Fig. 1. Lysosome-independent activation of mTORC1 in naïve CD4+ T cell responses.

(A) Naïve CD4+ T cells were activated with anti-CD3/anti-CD28 beads for 5 days followed by DQ-BSA treatment for 6 hours. Fluorescence of cleaved DQ-BSA was analyzed by flow cytometry to determine lysosomal activities (left). Phospho-S6K1 (Thr389) protein expression was determined by Western blotting (right). Results are from ten young (Y, 20–35 years) and ten older (O, 65–85 years) healthy individuals. Intensities of p-S6K1 protein expression were normalized to β-actin and are shown relative to the mean from young individuals. (B) Naïve CD4+ T cells from young individuals were activated for 5 days with the last 2 days in the presence of vehicle, chloroquine (CQ) or bafilomycin A1 (BafA1). Lysosomal activities (left) and mTORC1 activities (right) were determined as in (A). (C) Naïve CD4+ T cells from young individuals were transfected with control or TFEB siRNA and activated for 5 days. Lysosomal activities (left) and mTORC1 activities (right) were determined. (D) Heat map showing expression differences of genes involved in the amino acid signaling arm of the mTORC1 pathway, comparing the transcriptome of day 5-activated naïve CD4+ T cells from older and young adults (re-analyzed from (36)). (E) SLC7A5 and SLC7A1 transcripts from day 5-activated naïve CD4+ T cells from twelve 20–35 year-old and twelve 65–85 year-old healthy adults. Results are expressed relative to the mean from young individuals. (F) Chromatin accessibility at SLC7A5 gene in human Epstein-Barr (EBV), varicella-zoster (VZV) and influenza (Flu) virus-specific CD4+ T cells from young and older adults. Averaged tracks (young n=3, older n=4) at SLC7A5 show increased peak in highlighted (red) region. (G) SLC7A5 and SLC7A1 transcripts in samples from (B) and (C). (H) SLC7A5 and c-MYC protein expression in samples from (B) and (C). (I) c-MYC protein expression in samples from (A). (J) GSEA comparing fold transcript differences in young compared with older naïve CD4+ T cells on day 5 after stimulation (re-analyzed from (36)) with that of “HALLMARK_MYC_TARGETS”. (K) SLC7A5 and c-MYC protein expression in day 5-stimulated naïve CD4+ T cells from three older individuals transfected with control or MYC siRNA. Statistical significance by two-tailed unpaired t test (A, E and I) or two-tailed paired t-test (B, C, G, H and K). *p < 0.05, **p < 0.01, ***p < 0.001, ****p < 0.0001; NS, not significant.
