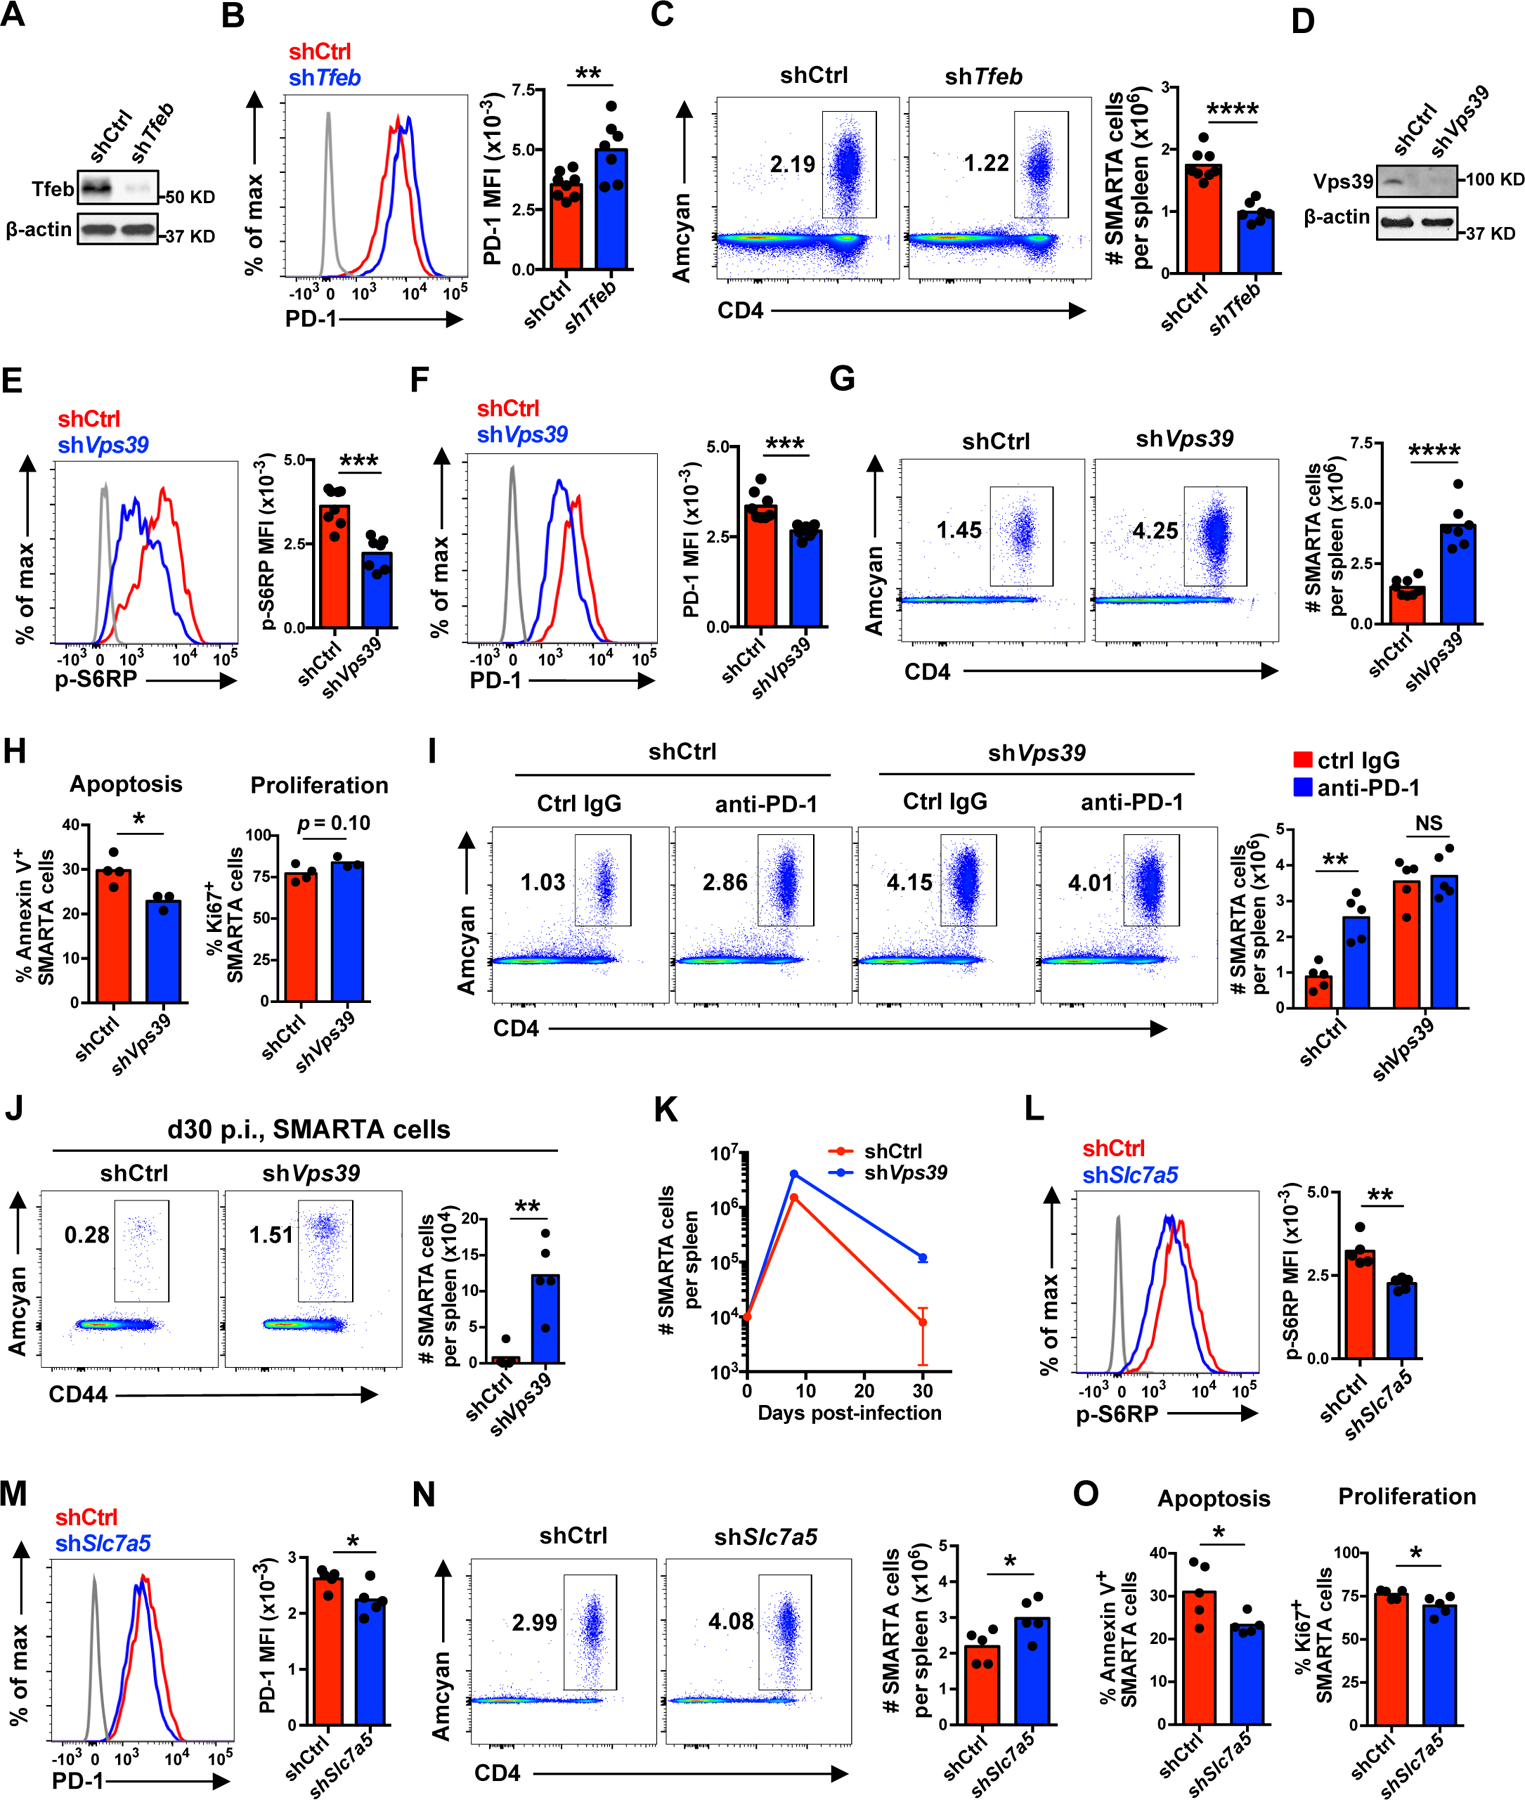
Fig. 6. Inhibition of late endosomal mTORC1 promotes primary CD4+ T cell responses after LCMV infection in vivo.

(A–C) 1 × 10⁴ Tfeb shRNA or control shRNA retrovirally transduced Amcyan+ LCMV-specific naïve SMARTA TCR transgenic CD4+ T cells were adoptively transferred into CD45.2+ naïve recipients followed by infection with LCMV Armstrong. On day 8 post infection, spleens were harvested and analyzed. FACS plots are gated on CD4+ Amcyan+ SMARTA cells. (A) Tfeb protein expression in transduced cells before adoptive transfer. (B) PD-1 expression on day 8 p.i. (C) SMARTA CD4+ T cell numbers per spleen on day 8 p.i. (D–K) Analysis of T cells responses as described in (A–C) after adoptive transfer of Vps39 shRNA transduced SMARTA CD4+ T cells. (D) Vps39 protein expression in transduced cells before adoptive transfer. (E) Phosphorylation of S6RP on day 8 p.i. (F) PD-1 expression on day 8 p.i. (G) SMARTA CD4+ T cell numbers per spleen on day 8 p.i. (H) Cell apoptosis and proliferation of transferred SMARTA CD4+ T cells on day 8 p.i. (I) Mice infected with LCMV after adoptive transfer of transduced cells were additionally treated with anti-PD-1 antibody (29F.1A12) or control IgG on days 0, 3 and 6 post infection. SMARTA CD4+ T cell numbers were determined on day 8 after LCMV infection. (J) SMARTA CD4+ T cell numbers in the spleen at day 30 after infection. (K) Longitudinal analysis of SMARTA cells in the spleen of LCMV-infected B6 mice. (L–O) 1 × 10⁴ Slc7a5 shRNA or control shRNA retrovirally transduced Amcyan+ LCMV-specific naïve SMARTA CD4+ T cells were adoptively transferred into CD45.2+ naïve recipients as in (A–C). Phosphorylation of S6RP (L), PD-1 expression (M), SMARTA cell numbers per spleen (N), and cell apoptosis and proliferation (O) of transduced SMARTA CD4+ T cells on day 8 post LCMV infection. Data are pooled from two independent experiments with 3–4 mice per group (B–C and E–G), representative of two independent experiments with 3–5 mice per group (A, D and H–K) or one experiment with 5 mice per group (L–O). Statistical significance by two-tailed unpaired t test (B–C, E–H and J–O) or one-way analysis of variance (ANOVA) followed by Tukey’s multiple comparisons test (I). The gray histograms represent naïve cells. *p < 0.05, **p < 0.01, ***p < 0.001, ****p < 0.0001; NS, not significant.
