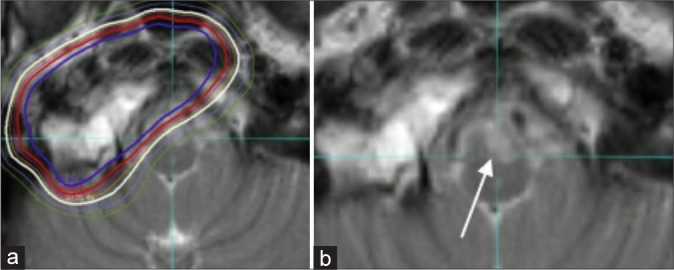
Figure 10:

Axial T2 images from radiation therapy planning (a) and 20 month follow-up (b) scans on a patient with a right petroclival residual chordoma demonstrating hyperintense T2 signal (white arrow) within the left ventral medulla interpreted as brainstem necrosis.
