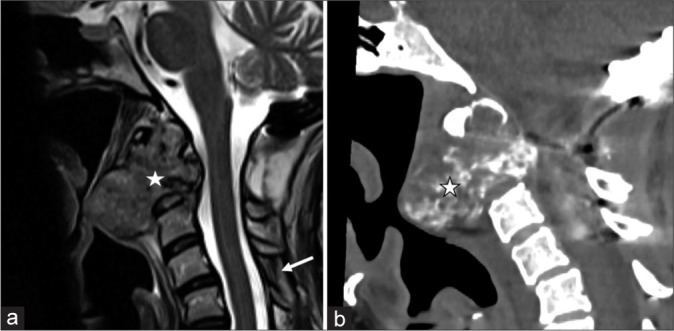
Figure 3:

Sagittal T2 (a) and sagittal unenhanced CT (b) demonstrating a poorly differentiated chordoma (white star) arising from the C2 vertebral body in a 40-year-old female. Note the hypointense matrix on the sagittal T2 image. The patient had undergone posterior decompression and craniocervical fusion before referral for proton therapy (white arrow). Note the irregular arc and ring pattern of calcification on CT (white star with black border).
