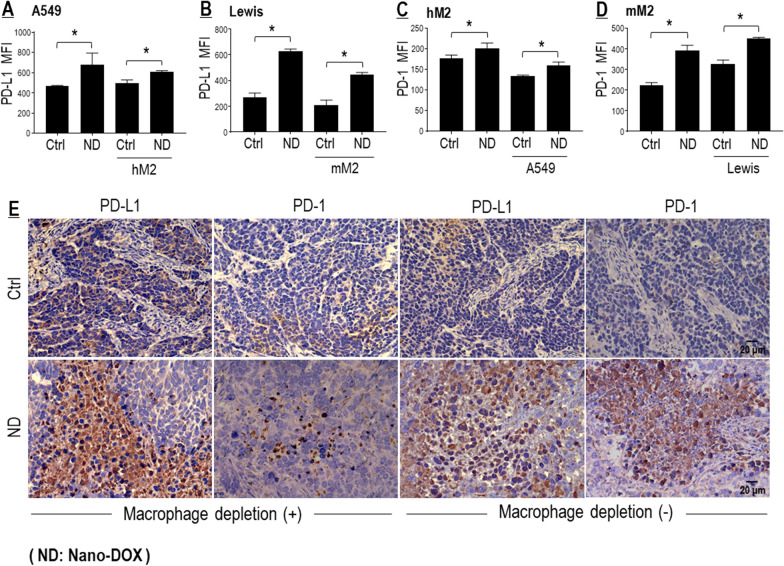
Fig. 3.
Nano-DOX induced PD-L1 in NSCLC cells and PD-1 in TAMs. A–D Nano-DOX induced PD-L1 in the in vitro cancer cells (A549 & Lewis) and PD-1 in the in vitro TAM models (hM2 & mM2) in monoculture and mixed-culture. Cell surface PD-L1 and PD-1 were assayed by FACS analysis of immunofluorescent staining. E Nano-DOX treatment led to increased immunohistological staining of PD-L1 and PD-1 in subcutaneous xenografts of Lewis cells in mice. FACS histogram geometric means were used to quantify mean fluorescence intensity (MFI). Geometric means were used to quantify mean fluorescence intensity (MFI). Values were means ± SD (n = 3, *p < 0.05). Drug concentration was 2 μg/mL for DOX and Nano-DOX in the in vitro experiments and treatment duration was 24 h. Representative FACS dot plots for A–D were provided in Additional file 1: Figure S3

