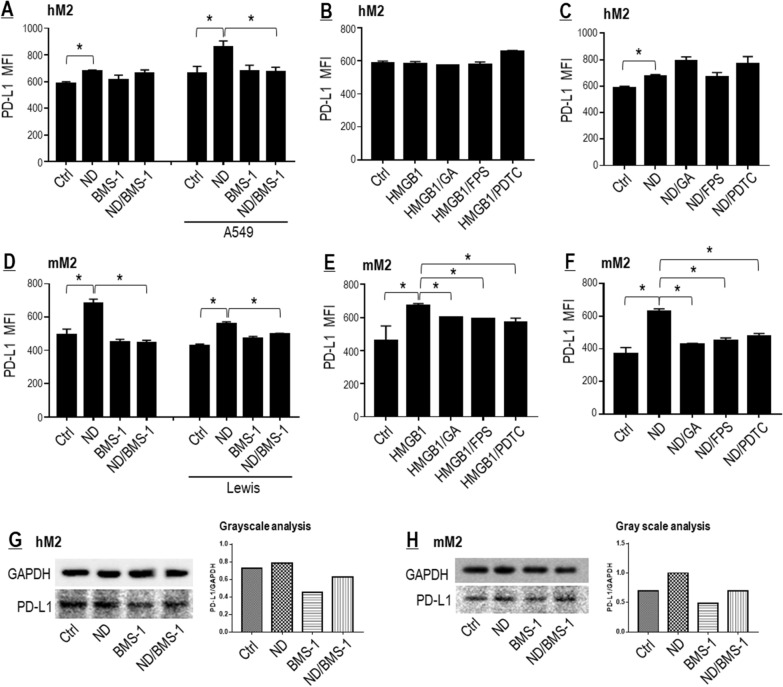
Fig. 7.
Nano-DOX induced PD-L1 in TAMs. A Nano-DOX induced cell surface PD-L1 in the hM2 both in the presence and absence of A549 cells. B Exogenously given HMGB1 did not induce cell surface PD-L1 in the hM2 and blockers of the HMGB1/RAGE/NF-κB pathway had little effect on cell surface PD-L1 expression. C Blockers of the HMGB1/RAGE/NF-κB pathway did not suppress Nano-DOX-induced cell surface PD-L1 in the hM2. D Nano-DOX induced cell surface PD-L1 in the mM2 both in the presence and absence of Lewis cells. E Exogenously given HMGB1 induced cell surface PD-L1 in the mM2 and this effect could be alleviated by blockers of the HMGB1/RAGE/NF-κB pathway. F Blockers of the HMGB1/RAGE/NF-κB pathway suppressed Nano-DOX-induced cell surface PD-L1 in the hM2. G, H Nano-DOX increased PD-L1 protein both in the hM2 and mM2. Cell surface PD-L1 was assayed by FACS analysis of immunofluorescent staining. PD-L1 protein was assayed by western blotting and grayscale analysis of the blot strips was performed. FACS histogram geometric means were used to quantify mean fluorescence intensity (MFI). Values were means ± SD (n = 3, *p < 0.05). Drug concentration was 2 μg/mL for DOX and Nano-DOX and 1 μM for BMS-1 in the in vitro experiments and treatment duration was 24 h. Representative FACS dot plots for A–F were provided in Additional file 1: Figure S7

