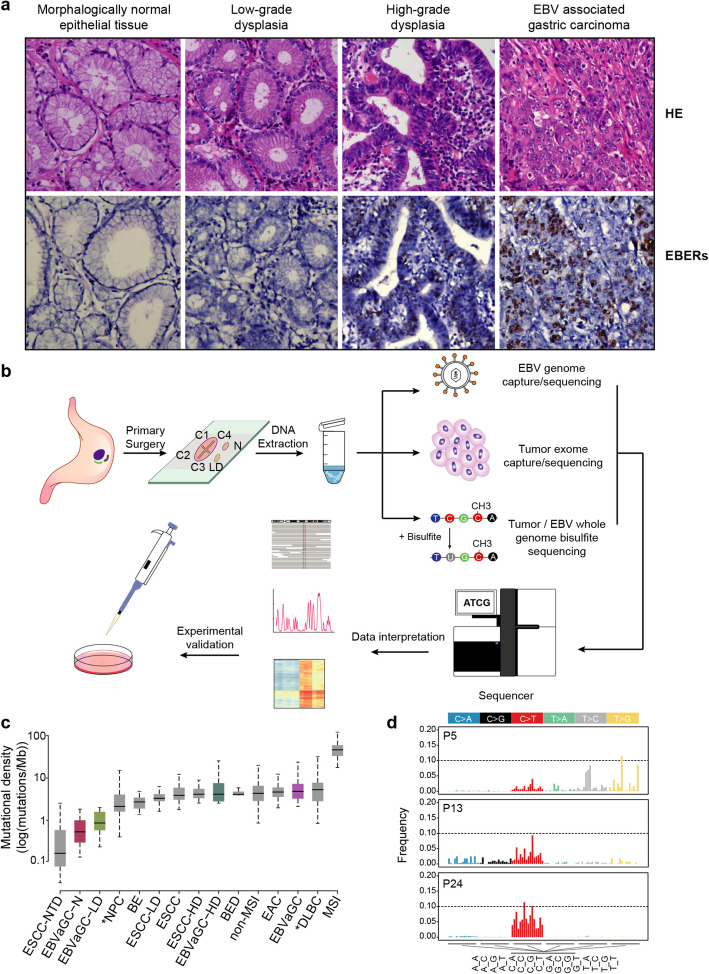
Fig. 1.
Mutational density and context of EBVaGCs and their precursor lesions. a Diagram showing the hematoxylin and eosin (HE)-stained (top) and in situ hybridization of Epstein-Barr-encoded RNA (bottom) sections of morphologically normal epithelial tissue (N), low-grade dysplasia (LD), high-grade dysplasia (HD), and EBV-associated gastric carcinoma (EBVaGC) from a representative patient P10. The magnification is 20-fold. b Schematic overview of the study design. Multiple regions covering different histological stages derived from the same patient were acquired. DNA was extracted and subjected to parallel genomic and epigenomic analyses for both host cells and EBV. c Comparison of the mutational density of normal tissues (n = 17), LDs (n = 19), HDs (n = 9), and EBVaGCs (n = 62) with other types of cancer. ESCC-NTD, esophageal squamous dysplasia from cancer-free patients (non-tumorous dysplasia, n = 13); NPC, nasopharyngeal carcinoma (n = 71); BE, non-dysplastic Barrett’s esophagus (n = 14); ESCC-LD, esophageal squamous low-grade dysplasia (n = 44); ESCC, esophageal squamous carcinoma (n = 62); ESCC-HD, esophageal squamous high-grade dysplasia (n = 31); BED, dysplastic Barrett’s esophagus (n = 11); non-MSI, non-microsatellite instable gastric carcinoma (n = 231); EAC, esophageal adenocarcinoma (n = 183); DLBC, diffuse large B cell lymphoma (n = 48); MSI, microsatellite instable gastric carcinoma (n = 64). Asterisk denotes other two EBV-positive cancer types. Box and whiskers denote the median, IQR, and 1.5 × IQR. The y-axis is shown on a log10-transformed scale. d Bar plots showing the mutational spectrum of three representative patients. Different colors denote the mutational direction, and the 3-bp mutational context are labeled below the x-axis

