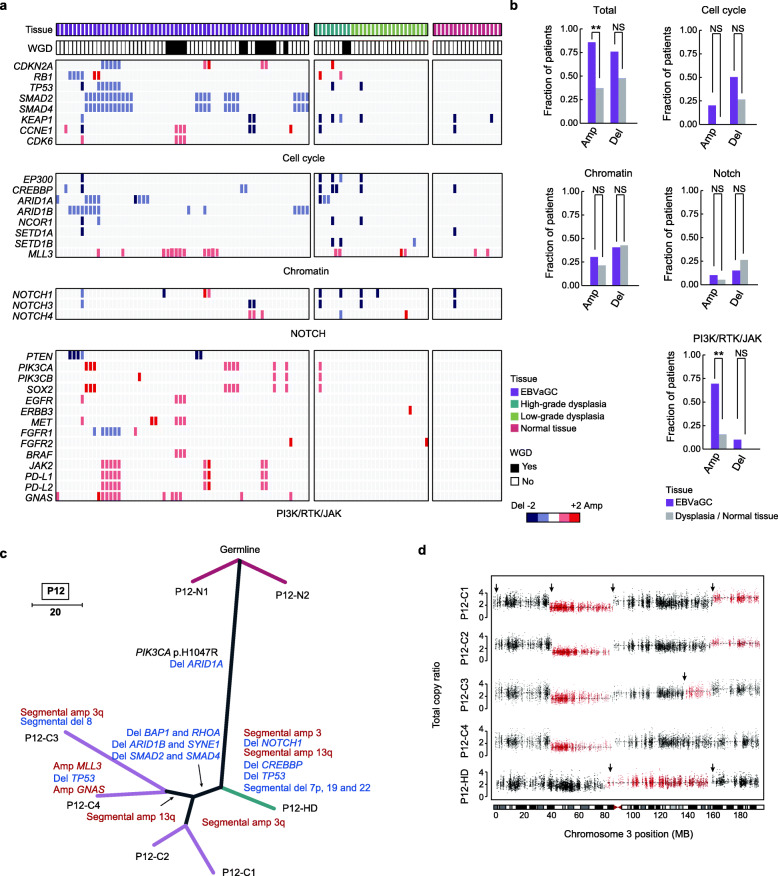
Fig. 3.
Copy number alterations of driver genes. a Diagram exhibiting the deletions (blue) and amplifications (red) of putative driver genes in EBVaGCs, dysplasia samples, and normal tissues. The histological types and whole-genome doubling (WGD) status of each sample are indicated on the top. b Bar plots comparing the frequencies of amplifications and deletions of different pathways in EBVaGCs and their precursor lesions over patients. Fisher’s exact test, **P < 0.01; NS, not significant. c Phylogenetic tree for patient P12. The length of each line is proportional to the number of mutations and copy number alterations (CNAs). Gray lines represent the clonal mutations shared by multiple samples. d Dot plots displaying the total copy ratio of segments in the HD sample (P12-HD) and 4 EBVaGCs from P12. Different segments are marked by red and black in turn, and breakpoints between two segments are indicated. The chromosome ideograms are shown on the bottom

