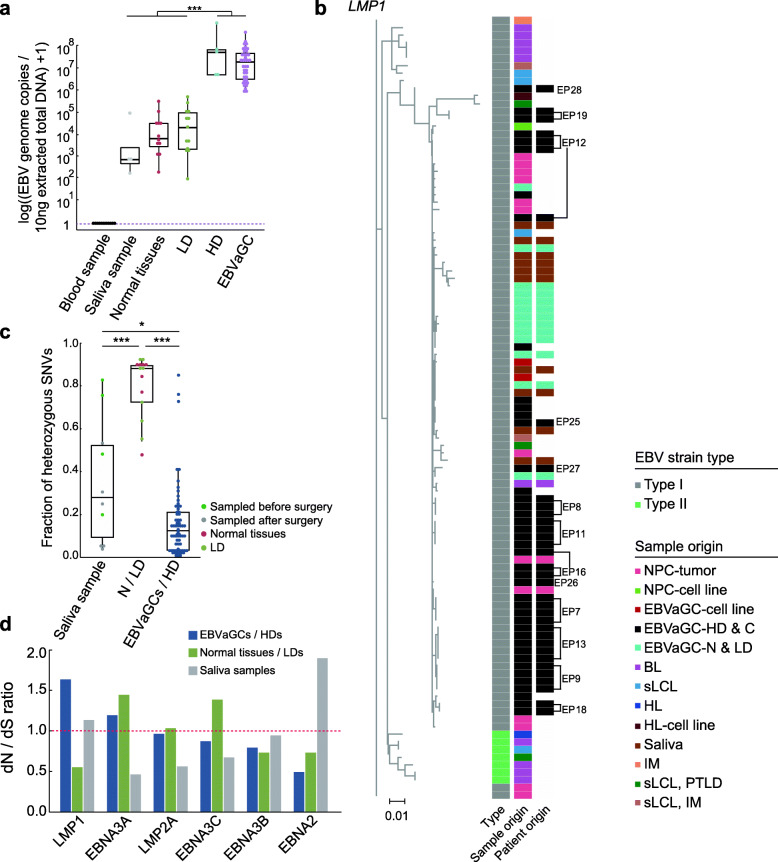
Fig. 5.
Analysis of EBV genomes in the saliva, normal tissues/LDs, and EBVaGCs/HDs. a Box plots comparing the EBV genome copies in peripheral blood samples (n = 13), saliva samples (n = 4), normal tissues (n = 12), LDs (n = 13), HDs (n = 5), and EBVaGCs (39). The y-axis is shown on a log10-transformed scale. Wilcoxon rank sum test, ***P < 0.001. b Left: phylogenetic tree of LMP1 nucleotide sequence from EBV genomes. Right: heatmaps displaying the EBV strain type, sample origin, and patient origin. For HD and EBVaGC samples from the same patients, patient IDs were denoted beside the heatmap. The scale bar of the phylogenetic tree represents 0.01 nucleotide substitution per site. IM, infectious mononucleosis; sLCL, spontaneous lymphoblastoid cell line; EBVaGC, EBV-associated gastric carcinoma; NPC, nasopharyngeal carcinoma; BL, Burkitt’s lymphoma; HL, Hodgkin’s lymphoma; PTLD, post-transplant lymphoproliferative disease. c Box plots comparing the fractions of heterozygous single nucleotide variations (SNVs) on EBV genomes from the saliva samples (n = 10), normal tissue/LDs (n = 14), and EBVaGCs/HDs (n = 70). Wilcoxon rank sum test, *P < 0.05, ***P < 0.001. d Bar plots displaying the dN/dS ratios of the selected genes of EBV genomes in the saliva samples, normal tissue/LDs, and EBVaGCs/HDs. The dashed line indicates a dN/dS value of 1

