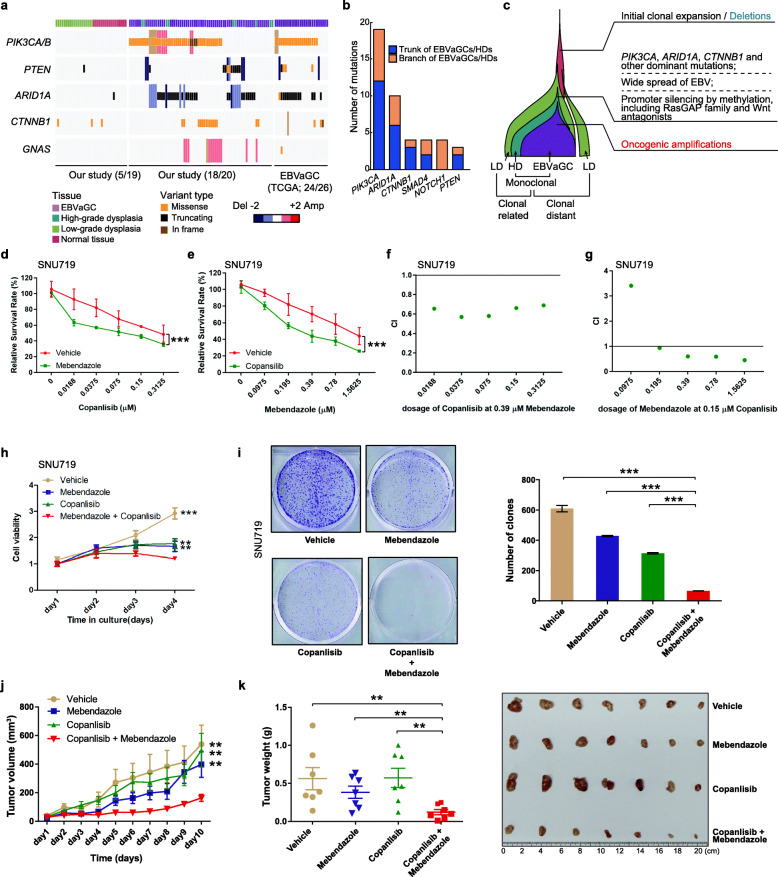
Fig. 7.
Synergistic function of the PI3K-Akt and Wnt pathways in EBVaGCs. a Heatmap of the recurrently mutated genes in the PI3K and Wnt pathways in precursor lesions (left) and EBVaGCs (middle, our study; right, TCGA data). The histological types of each sample are indicated on the top. b Bar plots displaying the number of “trunk” (gray) or “branch” (green) mutations in the indicated driver genes. c Schematics summarizing the evolutionary process of EBVaGC. Key events promoting the developmental process are denoted. d The growth curve of SNU719 cells treated with the indicated doses of PI3K inhibitor (copanlisib) at the presence of Wnt pathway inhibitor (0.39 μM mebendazole) or vehicle (n = 3). e The growth curve of SNU719 cells treated with the indicated doses of Wnt pathway inhibitor (mebendazole) at the presence of PI3K inhibitor (0.15 μM copanlisib) or vehicle (n = 3). f The CI of SNU719 cells treated with the indicated doses of copanlisib at the presence of 0.39 μM mebendazole. g The CI of SNU719 cells treated with the indicated doses of mebendazole at the presence of 0.15 μM copanlisib. h The growth curve of SNU719 cells treated with either 0.5 μM copanlisib or 0.3 μM mebendazole, or the combination (n = 3). i Comparison of colony formation of SNU719 cells with different treatments or vehicle (n = 3). j Tumor growth curve of SNU719 xenografts with different treatments (copanlisib 6 mg/kg, mebendazole 20 mg/kg) or vehicle (7 mice per group). k Tumor weight of SNU719 xenografts with different treatments or vehicle (7 mice per group). All statistics were conducted using Student’s t test, *P < 0.05, **P < 0.01, ***P < 0.001. Data are shown as mean ± SD

