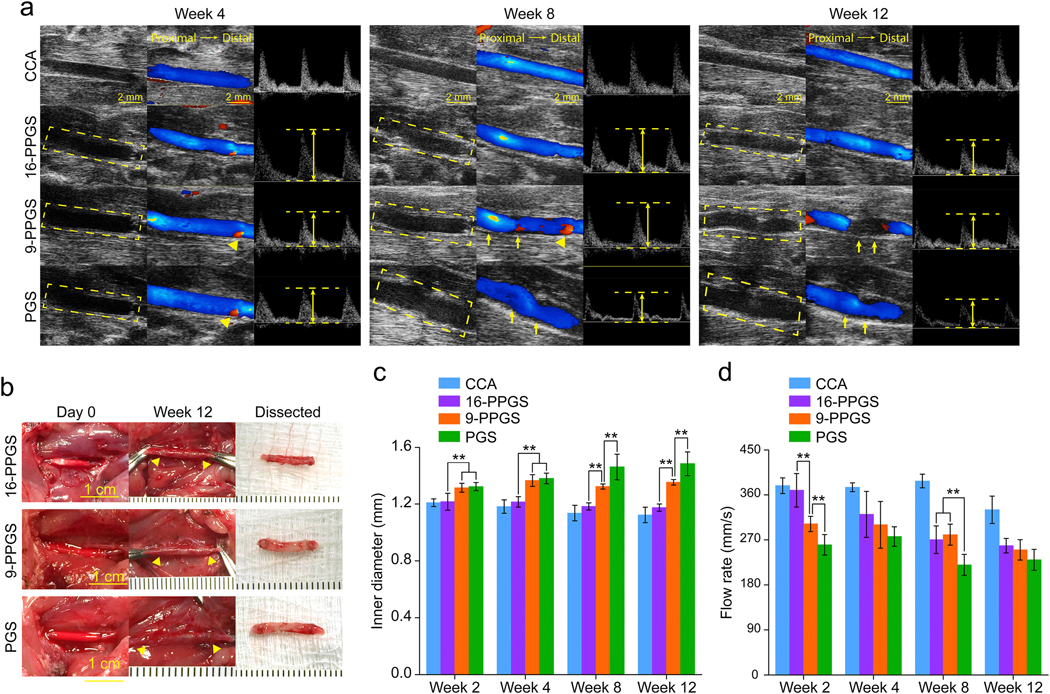
Fig. 2.
(a) Ultrasound images of three different types of grafts implanted into rat common carotid arteries. Left column: B mode; Middle column: color mode; Right column: PW mode. Dash squares indicate the implanted grafts. The height of double arrows indicates the rate of peak flow. Arrow heads indicate back flow of blood. Arrows indicate distortion of grafts. (b) Macroscopic views of three different types of grafts upon implantation and 12 weeks post-operation. Arrow heads indicate anastomosis sites. (c) Inner diameter of three different types of grafts 12 weeks post-implantation. (d) Peak rate of blood flow of three different types of grafts 12 weeks post-implantation. ** indicates p < 0.01, compared between two groups.

