Fig. 2.
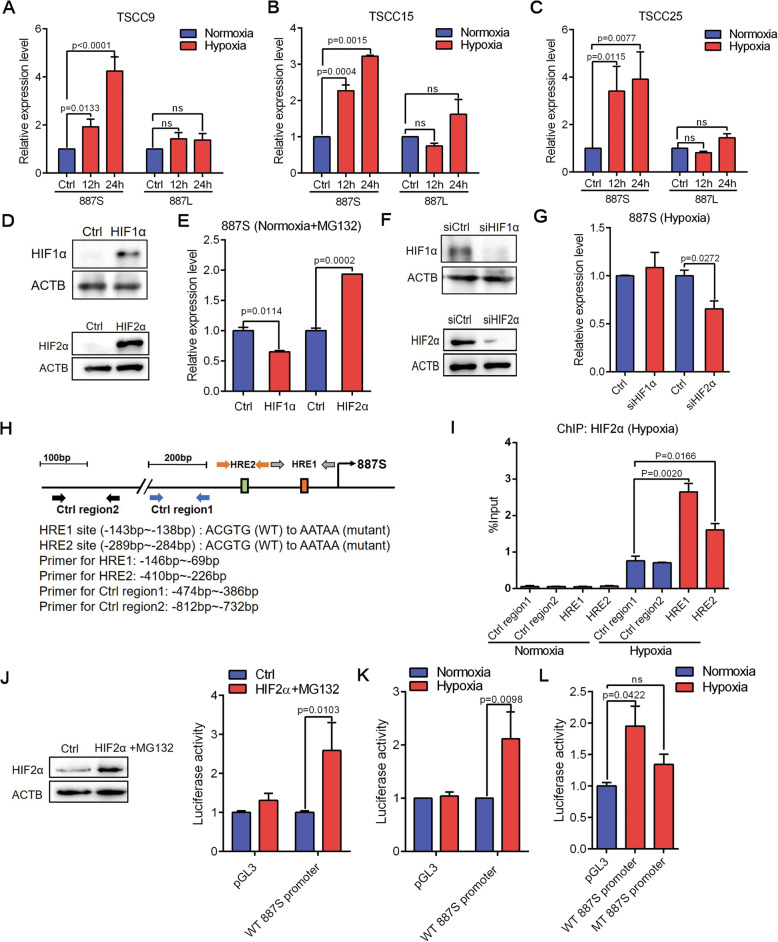
887S and 887L are differently modulated upon hypoxia. A–C Relative expression levels of 887S and 887L in TSCC9 (A), TSCC15 (B), and TSCC25 (C) in the presence of normoxia or hypoxia (n=3). D Overexpression efficiency of HIF1α (upper panel) or HIF2α (lower panel) with treatment of MG132 (10μM, 8h) in TSCC15 cells. (n=3). E Relative expression levels of 887S in response to HIF1α or HIF2α overexpression in the presence of MG132 (n=3). F Knockdown efficiency of HIF1α siRNA (upper panel) or HIF2α siRNA (lower panel) under hypoxia (n=3). G Relative expression levels of 887S in the presence of HIF1α or HIF2α siRNAs under hypoxia (n=3). H A schematic view of the 5’ regulatory regions of 887S with the relative location of HREs, wide-type, and mutant sequences of HREs, and the primers used in ChIP assays. I ChIP assay on the indicated regions of 887S promoter upon normoxia and hypoxia (n=3). J Overexpression efficiency of HIF2α with treatment of MG132 (10μM, 8h) in TSCC15 cells (left panel) and activity change of the pGL3 control (pGL3) or wild type (WT) 887S promoter after modulation of HIF2α (right panel). (n=4). K Activity change of the pGL3 control (pGL3) or wild type (WT) 887S promoter after modulation of oxygen levels (n=4). L Activity change of the WT or mutant (MT) 887S promoter in the presence of normoxia and hypoxia (n=4). Data are shown as means ± SEMs. P values are calculated using Student’s t test

