Figure 6.
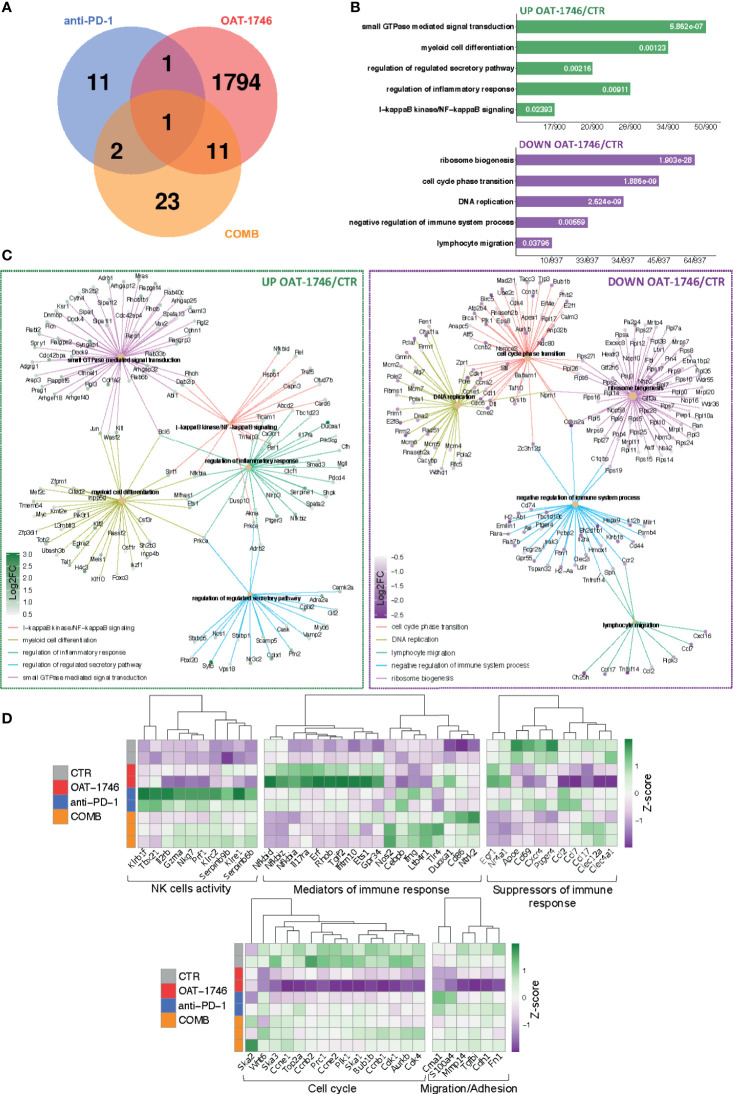
Transcriptomic profiles of CD11b+ from OAT-1746-treated mice show reduction of the pro-tumor phenotype genes and upregulation of gene expression indicative of antitumor responses. (A–D) Gene expression profiling was performed by RNA-seq of CD11b+ cells from the tumor-bearing hemispheres of mice from the experimental groups at day 21 post-implantation. (A) Venn diagram showing the number of differentially expressed genes (DEG) between OAT-1746, anti-PD-1 and COMB compared to the CTR group (padj<0.05). (B) Functional enrichment analysis with Gene Ontology (GO) biological processes for up- and downregulated genes in OAT-1746 compared to CTR. Enriched GO pathway names are shown, the size of the bars indicates the ratio of genes (a number of genes annotated to the pathway/total number of DEGs with adjusted p-values < 0.05). (C) Graphical representation of selected overrepresented categories among DEGs in the OAT-1746 versus the CTR group (D) Z-score heatmaps for selected genes represent the relative change in gene expression in the CD11b+ cells from OAT-1746, anti-PD-1 or COMB treated animals.

