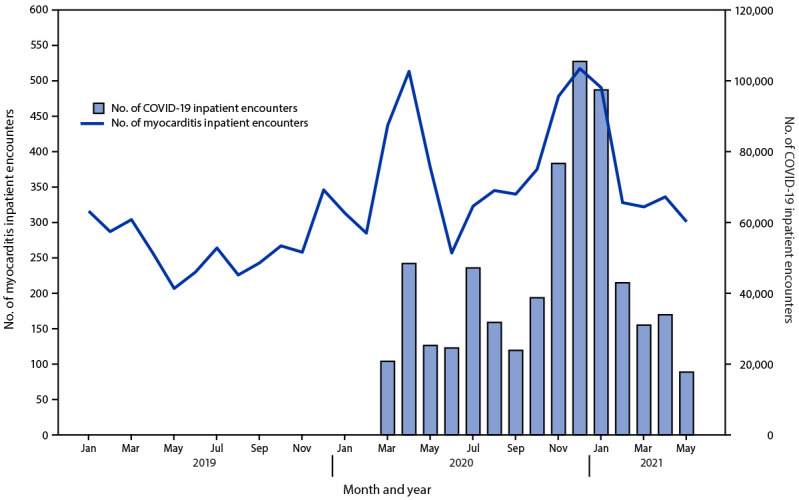
FIGURE 1.

Number of myocarditis and COVID-19 inpatient encounters, by month* — Premier Healthcare Database Special COVID-19 Release, United States, January 2019–May 2021
* Data from recent months might be incomplete.

Number of myocarditis and COVID-19 inpatient encounters, by month* — Premier Healthcare Database Special COVID-19 Release, United States, January 2019–May 2021
* Data from recent months might be incomplete.