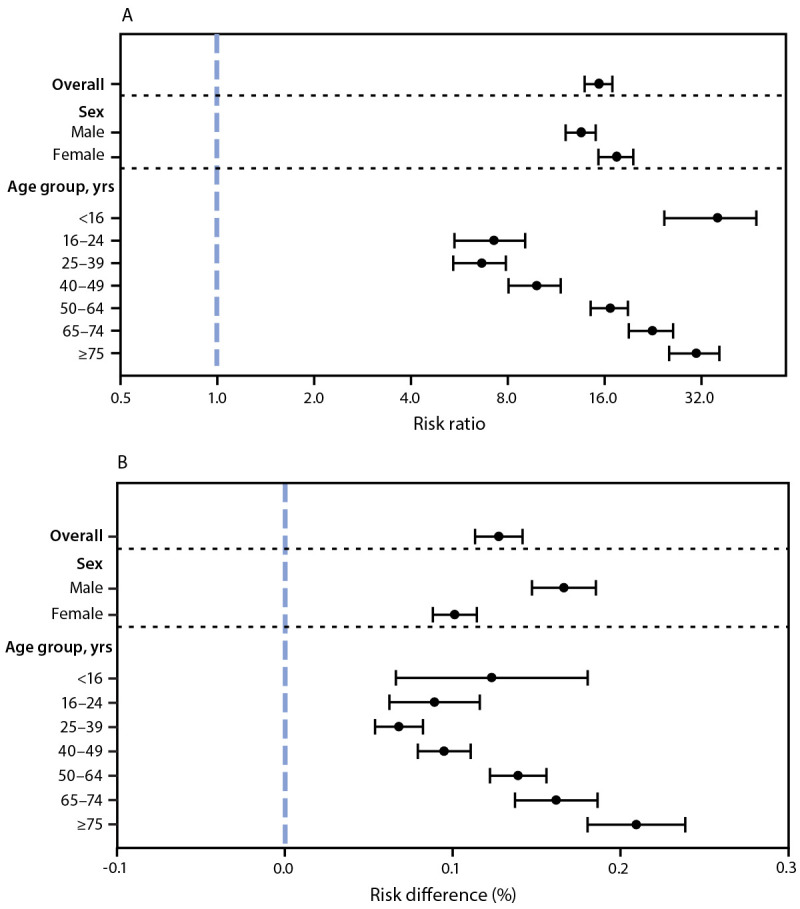
FIGURE 2.

Adjusted risk ratio (A) and adjusted risk difference (B) of myocarditis comparing patients with and without COVID-19,* overall and by sex and age group — Premier Healthcare Database Special COVID-19 Release, United States, March 2020–January 2021
* The panels show adjusted risk ratios (A) and adjusted risk differences (B) of myocarditis comparing patients with COVID-19 to patients without COVID-19 (reference), obtained from a single logit model with the following covariates: a three-way interaction between presence of COVID-19, sex, and age group, including lower-order interactions and main effects; race/ethnicity; payer type; hospital U.S. Census region; and hospital urbanicity. 95% confidence intervals indicated by error bars.
