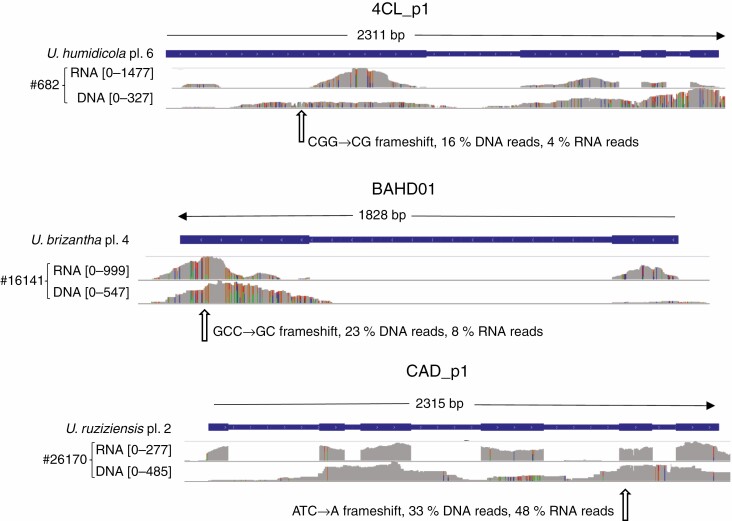
Fig. 4.
Read coverage for both RNAseq and DNAseq mapped to U. ruziziensis gene models of three cell wall genes for accessions which carry LOF alleles. Numbers within square brackets are the scale of coverage in number of reads. Gene model structure is indicated on the blue bar – wider parts are exons. Species name, ploidy level (pl.) and LOF polymorphisms are indicated. The numbers following ‘#’ are the CIAT accession numbers identifying the accessions carrying LOF alleles. Coverage graphs are grey when matching the reference; at variant positions, colours indicate bases (green A, blue C, orange G, red T).

