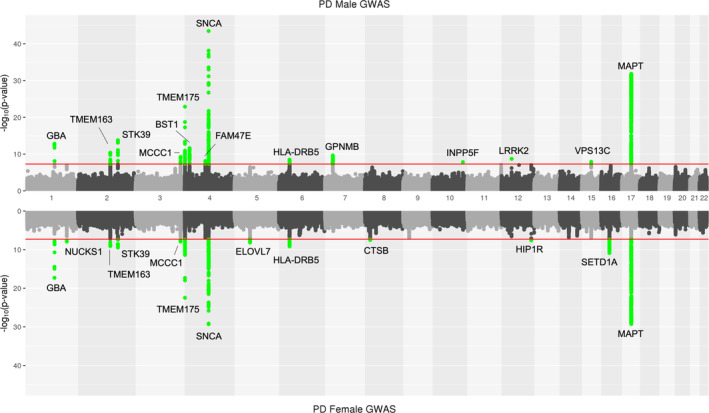
FIGURE 1.

Mirror Manhattan plot of male and female specific Parkinson's disease GWAS. On the top male PD GWAS, and bottom female PD GWAS. The red line indicates the ‐log10 p value genomewide significant threshold of 5E‐8. Green dots indicate variants passing genomewide significance. Note that green highlighted signals do not represent male or female specific Parkinson's disease GWAS signals and that for each region of interest nominal significance is identified in the opposite Manhattan plot. Signals are annotated based on the closest gene from ref. 11. GWAS = genomewide association studies; PD = Parkinson's disease. [Color figure can be viewed at www.annalsofneurology.org]
