
FIGURE 2.
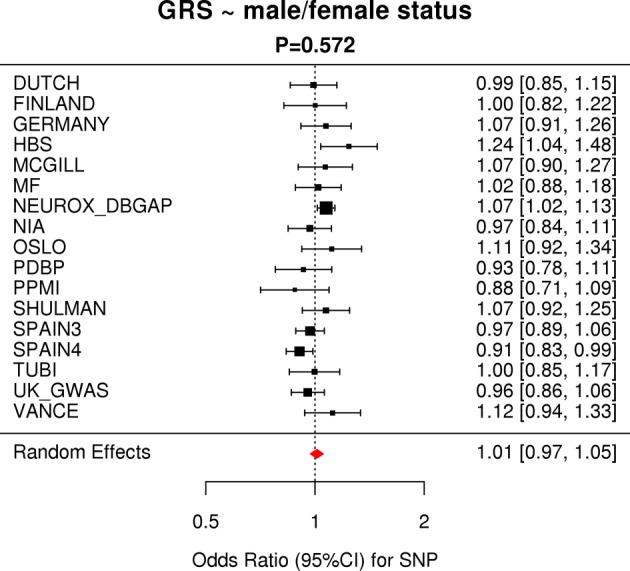
Meta‐analysis of the genetic risk score versus male/female status shows no difference between “genetic load” of Parkinson's disease associated risk. Red diamond indicates the effect estimate (odds ratio) and 95% confidence interval of the aggregate result. CI = confidence interval; GRS = genetic risk score; SNP = single nucleotide polymorphism. [Color figure can be viewed at www.annalsofneurology.org]