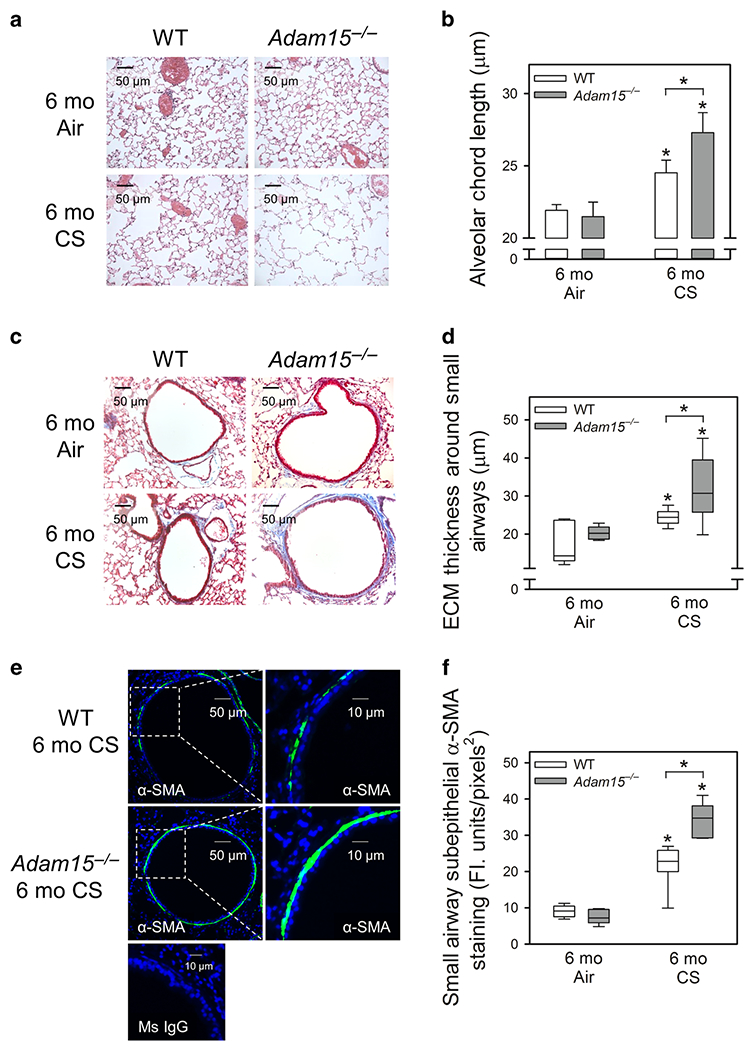
Figure 2: Adam15 deficiency in mice increases CS-induced emphysema development and small airway fibrosis.

Adult Adam15−/− mice and WT mice were exposed to air or CS 6 days-a-week for 6 months (Mo). A: Images of hematoxylin and eosin-stained inflated lung sections from mice. B: Airspace size was quantified in Gills-stained lung sections using Scion image analysis software, as described in the Methods. The mean chord length is the average of the horizontal and vertical distances between the alveolar walls. Data are mean ± SD; n = 8-11 mice exposed to air and 11-14 mice exposed to CS. Data were analyzed using a One-Way ANOVA followed by pair-wise testing with two-tailed Student’s t-tests. *, P ≤ 0.035 versus the same genotype exposed to air or the group indicated. C shows representative images of extracellular matrix (ECM) deposition around small airways (300-699 μm in diameter) in Masson Trichrome-stained lung sections from WT and Adam15−/− mice exposed to air or CS for 6 months. D: The thickness of the ECM protein layer deposited around small airways was quantified using morphometry methods, as described in the Methods. The boxes in the box-plots show the medians and 25th and 75th percentiles, and the whiskers show the 10th and 90th percentiles; n = 7-10 mice/group. Data were analyzed using a Kruskal-Wallis One-Way ANOVA followed by pair-wise testing with Mann-Whitney U tests. *, P ≤ 0.038 versus the same genotype exposed to air or the group indicated. In E, murine lung sections were immunostained for α-smooth muscle actin (α-SMA, a marker of myofibroblasts or smooth muscle cells) around small airways of WT and Adam15−/− mice that were exposed to air or CS for 6 months. Nuclei were counterstained blue with 4′,6-diamidino-2-phenylindole. As a control, lung sections were stained with a non-immune murine (Ms) IgG (bottom panel). The merged images shown in E are representative of 5-7 mice/group. F: Box-plots of α-SMA staining that was quantified per unit area of the walls of small airways having a luminal diameter of 300-699 μm using MetaMorph software (5 air-exposed mice/group and 6-7 CS-exposed mice/group). The boxes in the box-plots show the medians and 25th and 75th percentiles, and the whiskers show the 10th and 90th percentiles. Data were analyzed using a Kruskal-Wallis One-Way ANOVA followed by pair-wise testing with Mann-Whitney U tests. *, P ≤ 0.005 versus air-exposed mice belonging to the same genotype or the group indicated.
