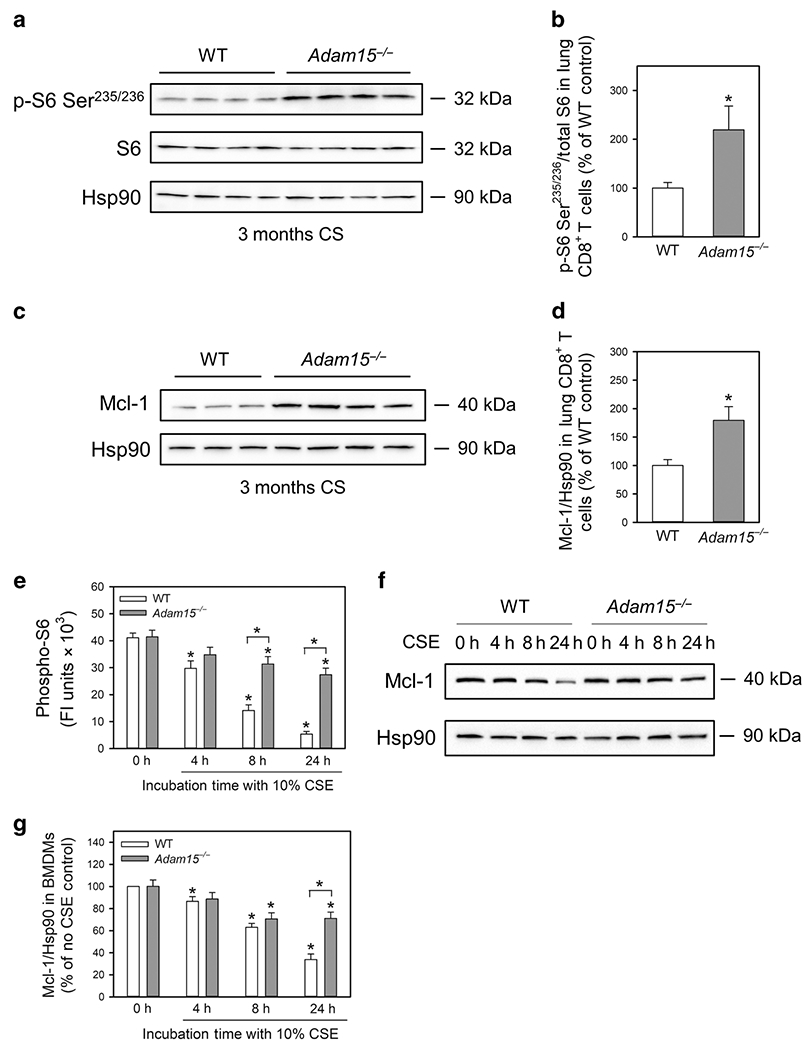
Figure 8: Deficiency of Adam15 in macrophages and CD8+ T cells presences activation of the mTOR-Mcl-1 pro-survival pathway when cells are exposed to CS.

In A-D, CD8+ T cells were isolated from the lungs of WT and Adam15−/− mice that had been exposed to CS for 3 months. In A, phosphorylated S6 (p-S6-Ser235/236), total S6 (S6), and a housekeeping control (heat shock protein-90; Hsp90) were quantified in extracts of the pulmonary CD8+ T cells using Western blotting and densitometry. The p-S6-Ser235/236 signals were normalized to total S6 levels and expressed as a % of the values for WT mice. The images shown in A are representative of 4 mice per group. B: The bars show means ± SD (n = 4 mice/group). Data were analyzed using a One-Way ANOVA followed by pair-wise testing with two-tailed Students t-tests. *, P ≤ 0.01 versus the WT control. In C-D, intracellular protein levels of Mcl-1 and Hsp90 were quantified in pulmonary CD8+ T cells from CS-exposed mice using Western blotting and densitometry. The Mcl-1 signals were normalized to Hsp90 levels and expressed as a % of the values for WT mice. The images shown in C are representative of 3-4 mice per group. D: The bars show means ± SD (n = 3-4 mice/group). Data were analyzed using a One-Way ANOVA followed by pair-wise testing with two-tailed Students t-tests. *, P ≤ 0.004 versus the WT control. In E-G, bone marrow-derived macrophages (BMDMs) were isolated from unchallenged WT and Adam15−/− mice and exposed to 10% CSE for up to 24 h. In E, BMDMs were fixed, permeabilized, and immunostained with a green fluorophore for intracellular phosphorylated ribosomal protein S6 (p-S6), and the nuclei were counterstained blue with 4′,6-diamidino-2-phenylindole. Control cells were stained with a primary non-immune rabbit (Rb) IgG (right panels). P-S6 staining in BMDMs was quantified, as described in the Methods. Data are mean ± SD and data were analyzed using a One-Way ANOVA followed by pair-wise testing with two-tailed Students t-tests. *, P ≤ 0.01 versus the control. In F-G, intracellular protein levels of Mcl-1 and Hsp90 were quantified in CSE-treated BMDMs using Western blotting and densitometry. The images shown in G are representative of 7 mice/group. In G, the Mcl-1 signals were normalized to Hsp90 levels and expressed as a % of the values for controls cells incubated without CSE. Data are mean ± SD; n = 7 mice/group. Data were analyzed using a One-Way ANOVA followed by pair-wise testing with two-tailed Student’s t-tests. *, P ≤ 0.004 versus no CSE control belonging to the same genotype or the group indicated.
