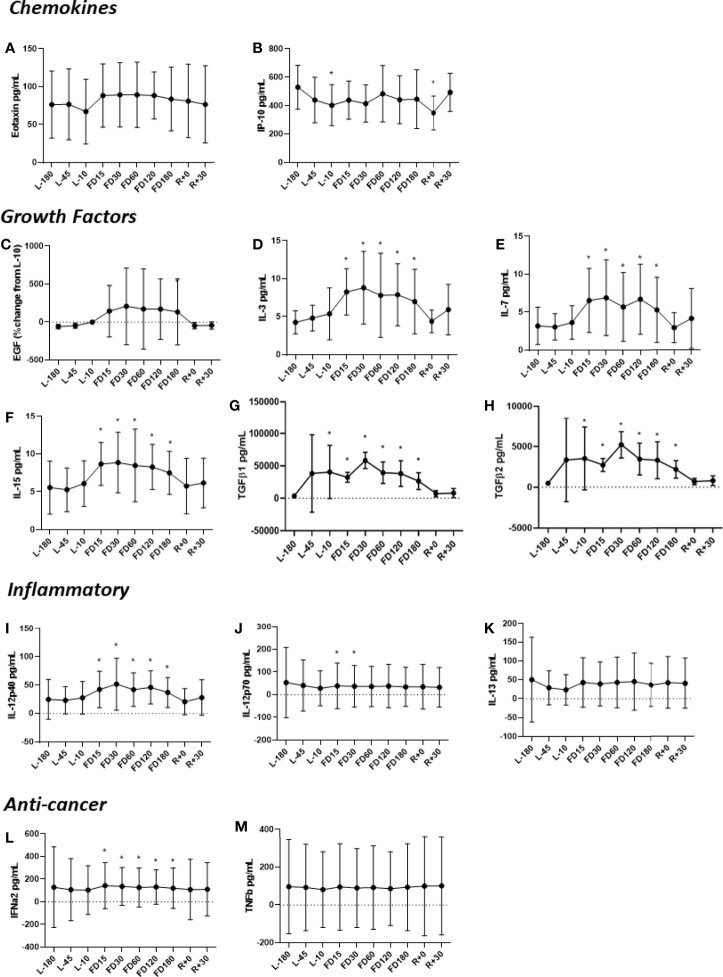
Figure 1.
Concentrations of plasma (A) Eotaxin, (B) IP-10, (C) EGF, (D) IL-3, (E) IL-7, (F) IL-15, (G) TGFβ1, (H) TGFβ2, (I) IL-12p40, (J) IL-12p70, (K) IL-13, (L) IFNα2 and (M) TNFβ before, during and after spaceflight. The TGFβ assessments (G, H) represent quantitation of the active form of the molecule. Data are mean± SD. Significance was evaluated via a Student’s t test by comparing all other data points to L-180 baseline data. Significant differences (P ≤ 0.05) are indicated (*).

