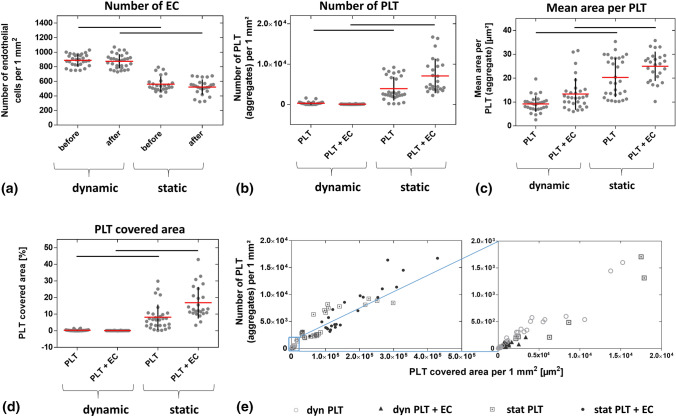
Figure 3.
Number of adherent endothelial cells (EC) and platelets (PLT) as well as mean area per PLT and PLT covered area after co-culture under dynamic and quasi-static conditions. EC were cultured for six days either under laminar flow (10 dyn cm−2) or quasi-static conditions (0.01 dyn cm−2) prior to the addition of PLT. Shown are the number of EC (a) and PLT (b) as well as the mean area per PLT (c) and PLT covered area (d) before and after co-culture under dynamic and static conditions. Figure E shows the relation between PLT number and PLT covered area. Data in the blue rectangle of the left image are magnified in the right image. Arithmetic mean (red) ± standard deviation (black). Data are mean from three independent experiments using PLT of one donor per experiment cultivated on one to two slides whereas five images were taken per slide (n = 25–30). Lines = p < 0.0001. Legend: empty circle: PLT incubated under laminar flow, triangle: PLT incubated with EC under laminar flow, square with point: PLT incubated under static conditions, black circle: PLT incubated with EC under static conditions.

