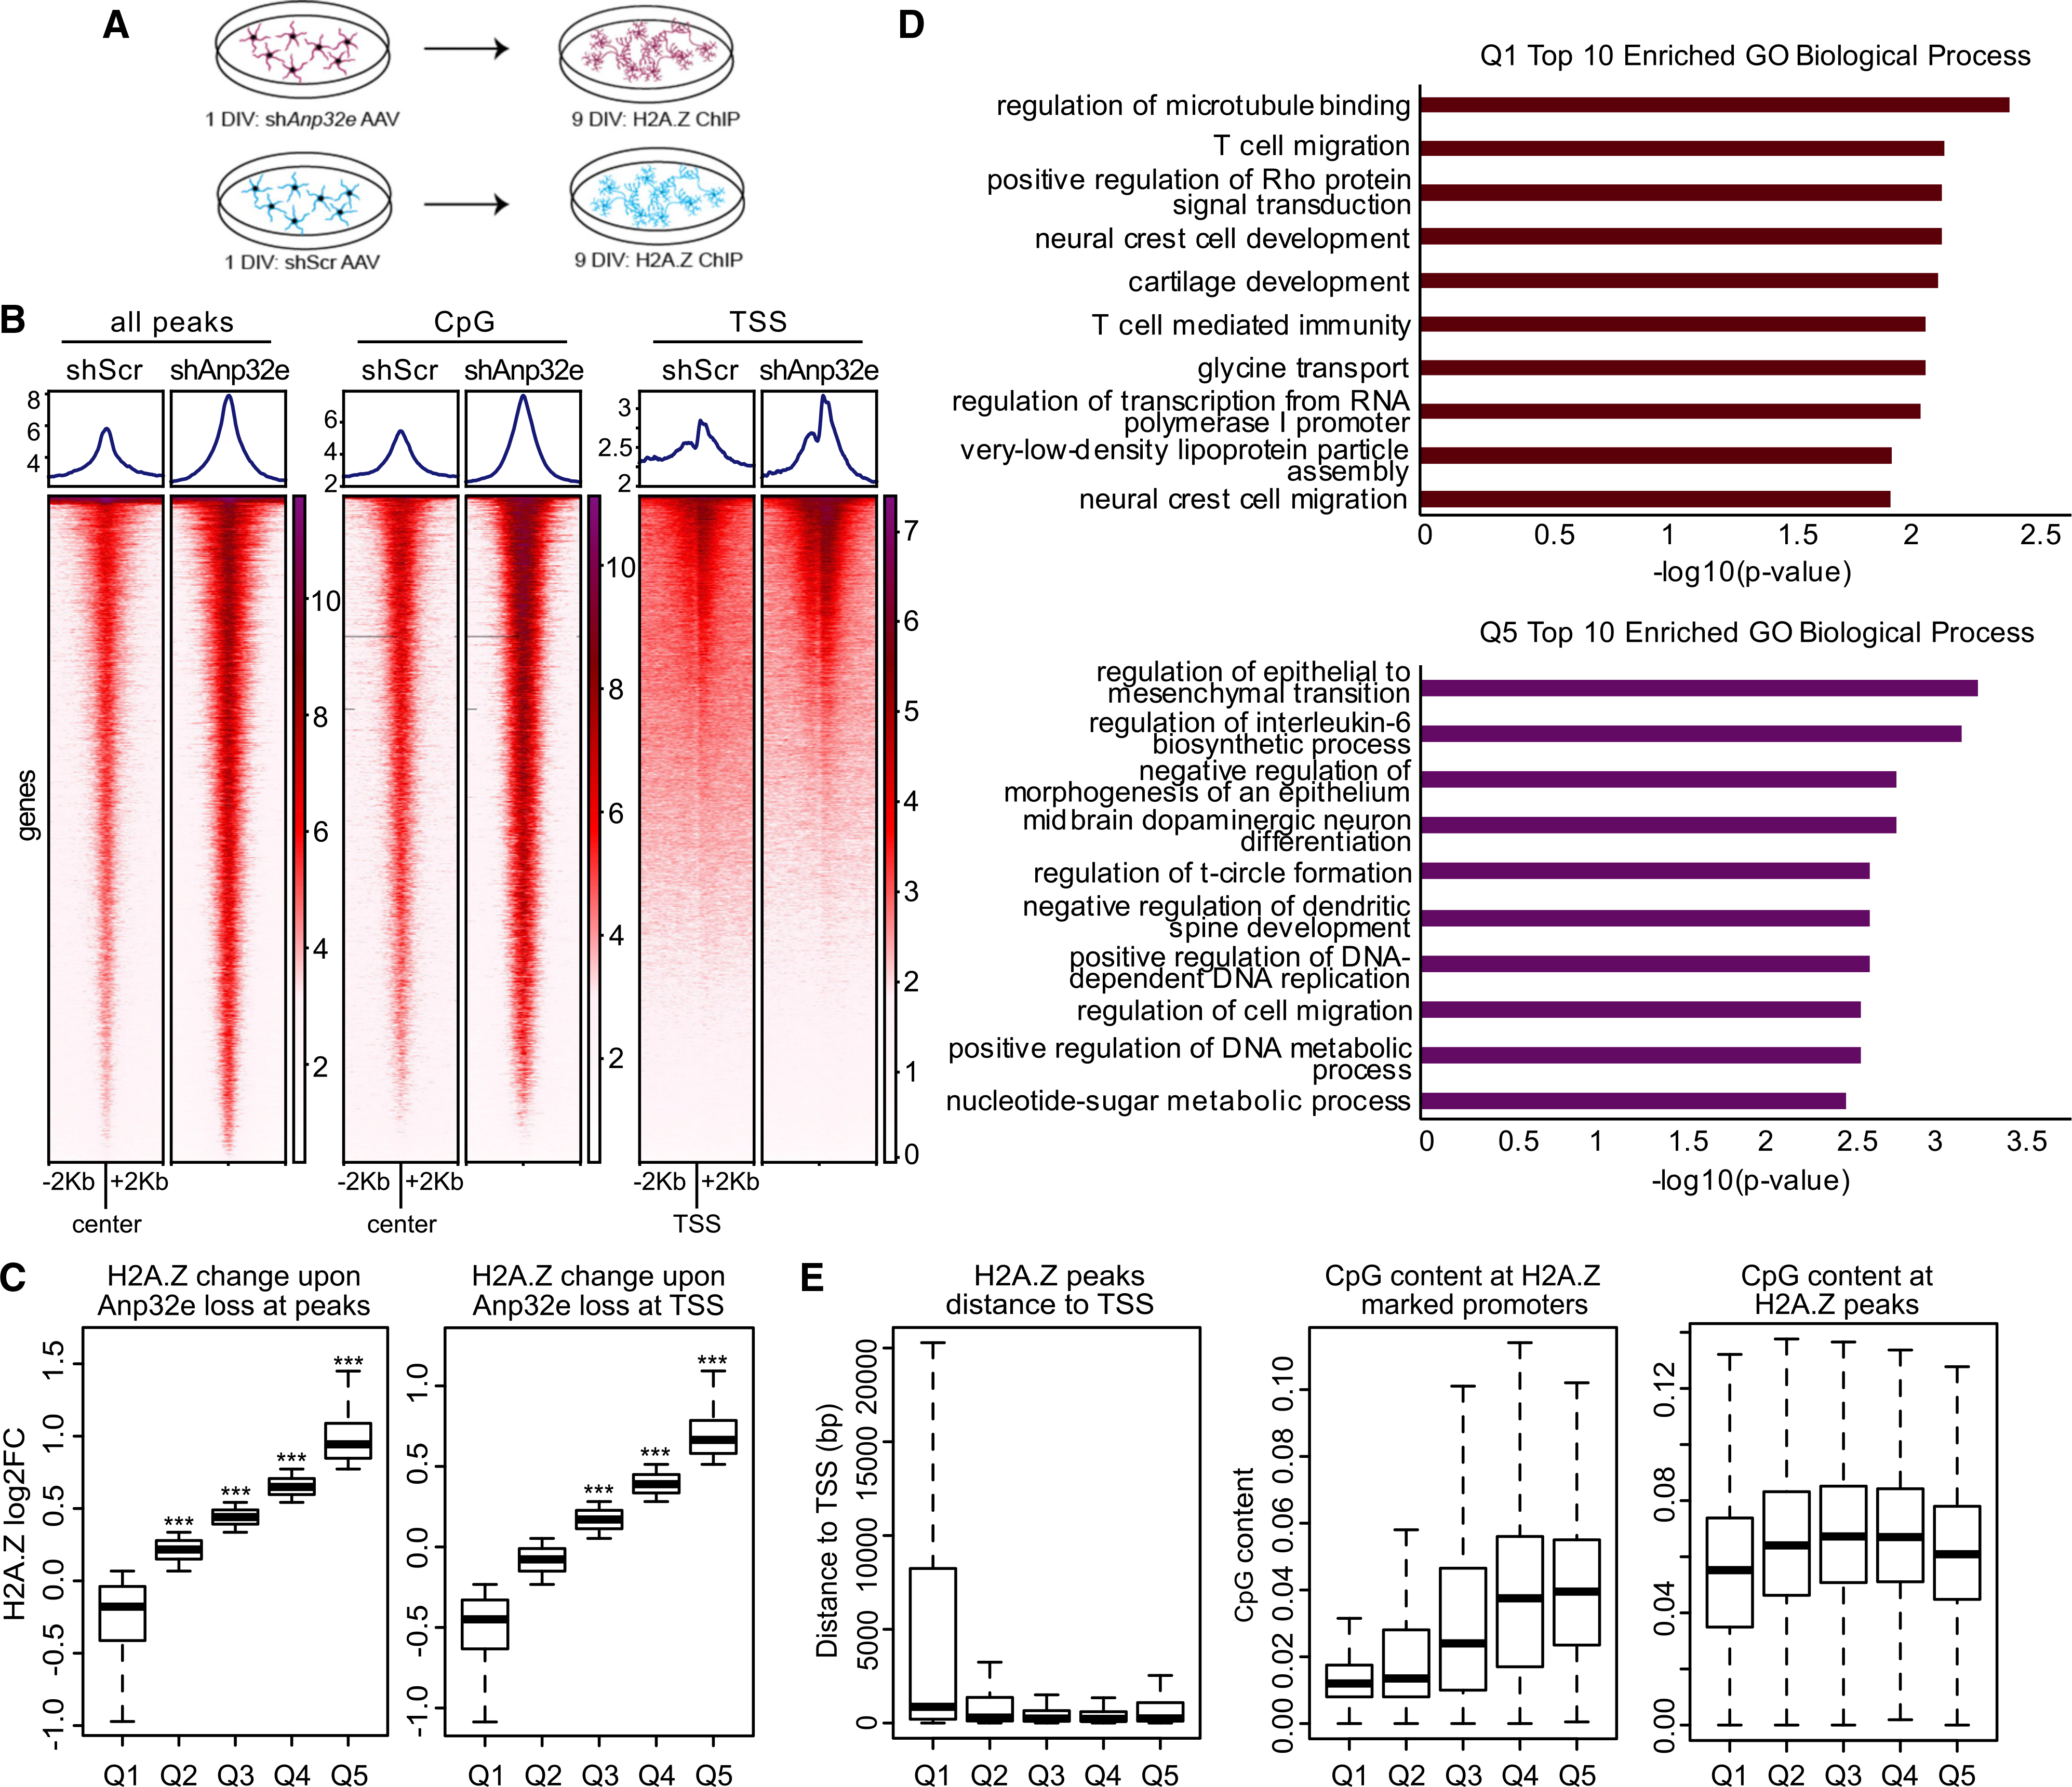
Figure 2. Anp32e depletion results in H2A.Z accumulation in neuronal chromatin.

(A) Schematic representation of the experimental workflow in cultured hippocampal neurons.
(B) H2A.Z signal was assessed with ChIP sequencing (ChIP-seq) and analyses were conducted in several regions of interest, including sites of H2A.Z binding in the mouse hippocampus (left), CpG islands (middle), and TSS-flanking regions (right) in scramble control and Anp32e-depleted neurons.
(C) Boxplot representing change in H2A.Z enrichment at hippocampally determined H2A.Z peaks (left) or TSS-flanking loci (right). p values were generated from t tests comparing quantiles to a randomized normal distribution of log2 fold change (log2FC) change values with the mean of zero.
(D) Gene Ontology of biological processes for genes showing H2A.Z decrease, Q1 (top), or increase, Q5 (bottom), with Anp32e depletion at promoters identified in the mouse hippocampus.
(E) Boxplot representing the distance of H2A.Z peaks from the TSS (left), CpG content at H2A.Z promoters (middle), and CpG content at H2A.Z peaks (right).
