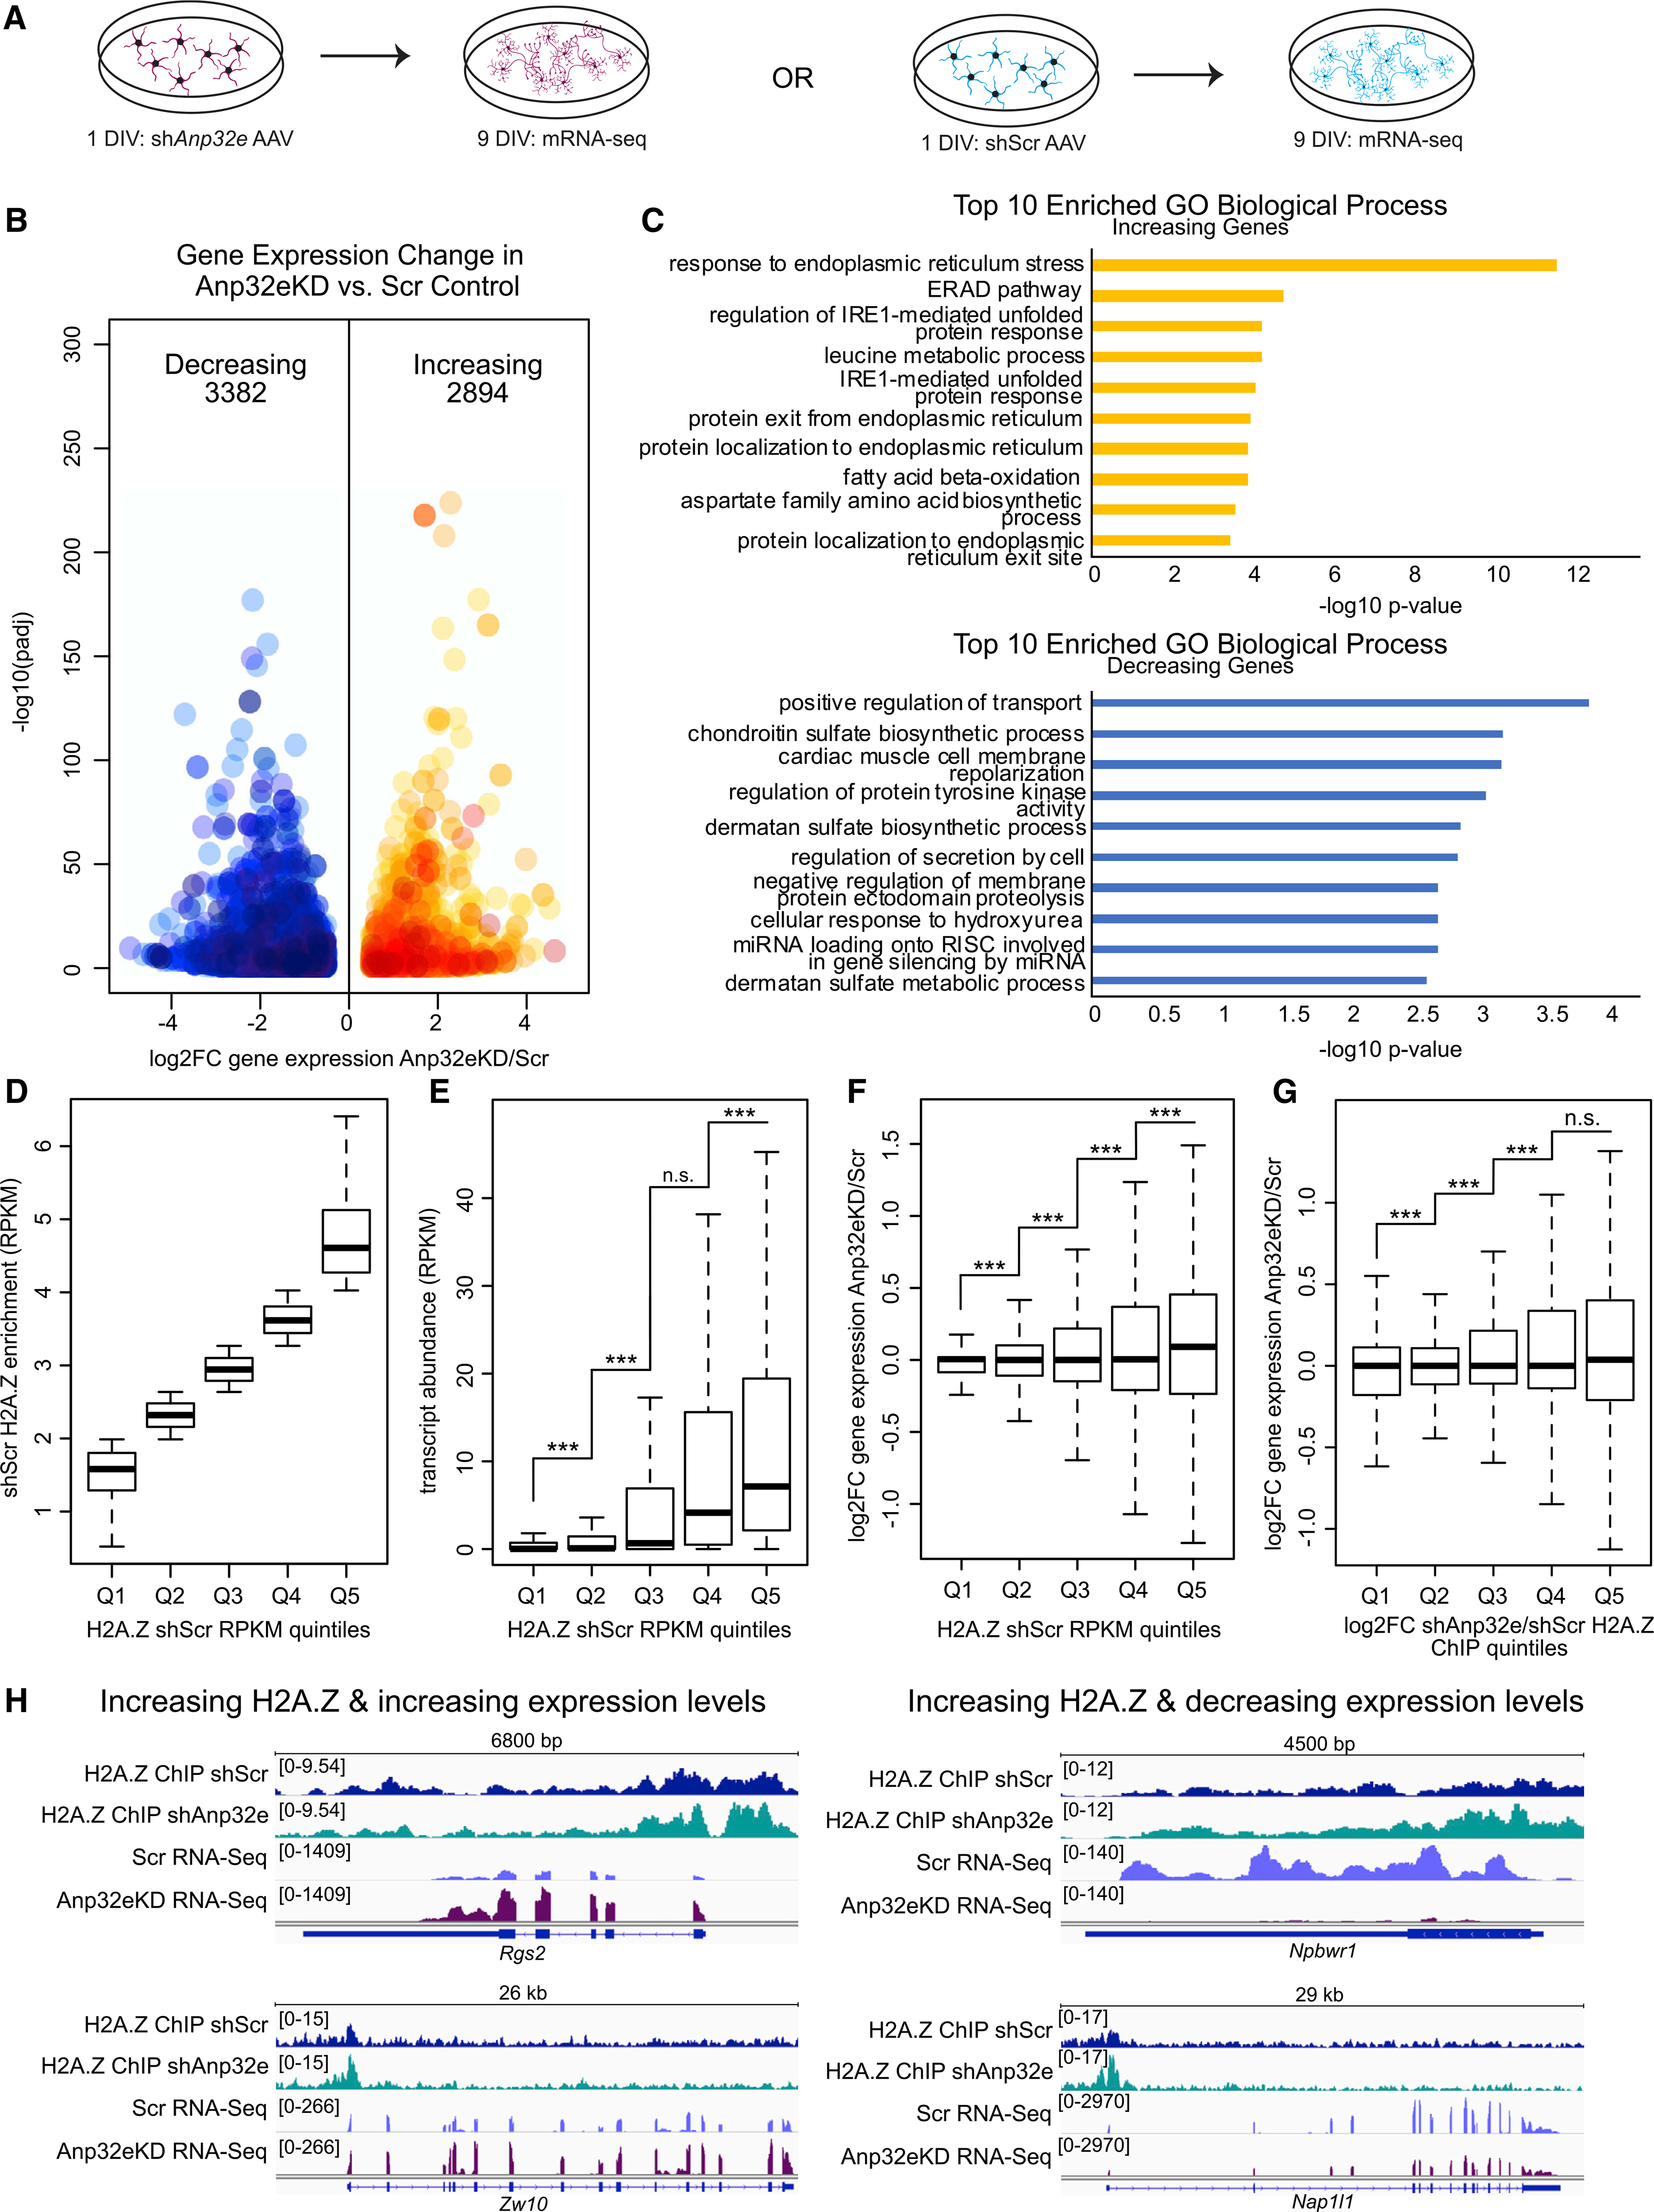
Figure 3. Anp32e depletion regulates neuronal gene expression.

(A) Experimental strategy for measuring gene expression changes in Anp32e-depleted neurons (left) compared with control (right). 3 replicates per condition.
(B) Volcano plot depicting gene expression changes with decreases in blue and increases in orange. DESeq2 was used to determine significance (y axis) and log2FC (x axis) upon Anp32e loss.
(C) Bar charts depicting results from Gene Ontology analysis for increasing (top) and decreasing (bottom) genes with significance measurements on the x axis.
(D) Quintiles were assigned based on H2A.Z levels in control samples.
(E) RNA transcript abundance (RPKM) was measured at promoters based on quintiles defined in (D). p values are from two-tailed Student’s t tests.
(F) Changes in gene expression were measured for all gene promoters separated based on quintiles defined in (D). p values are from two-tailed Student’s t tests.
(G) Quintiles were assigned based on H2A.Z enrichment changes upon Anp32e depletion (Q1–Q5) and log2FC gene expression changes were measured at promoters. p values are from two-tailed Student’s t tests.
(H) Genome browser screen shots provide examples where changes in H2A.Z coincide with gene expression changes.
See also Table S1.
