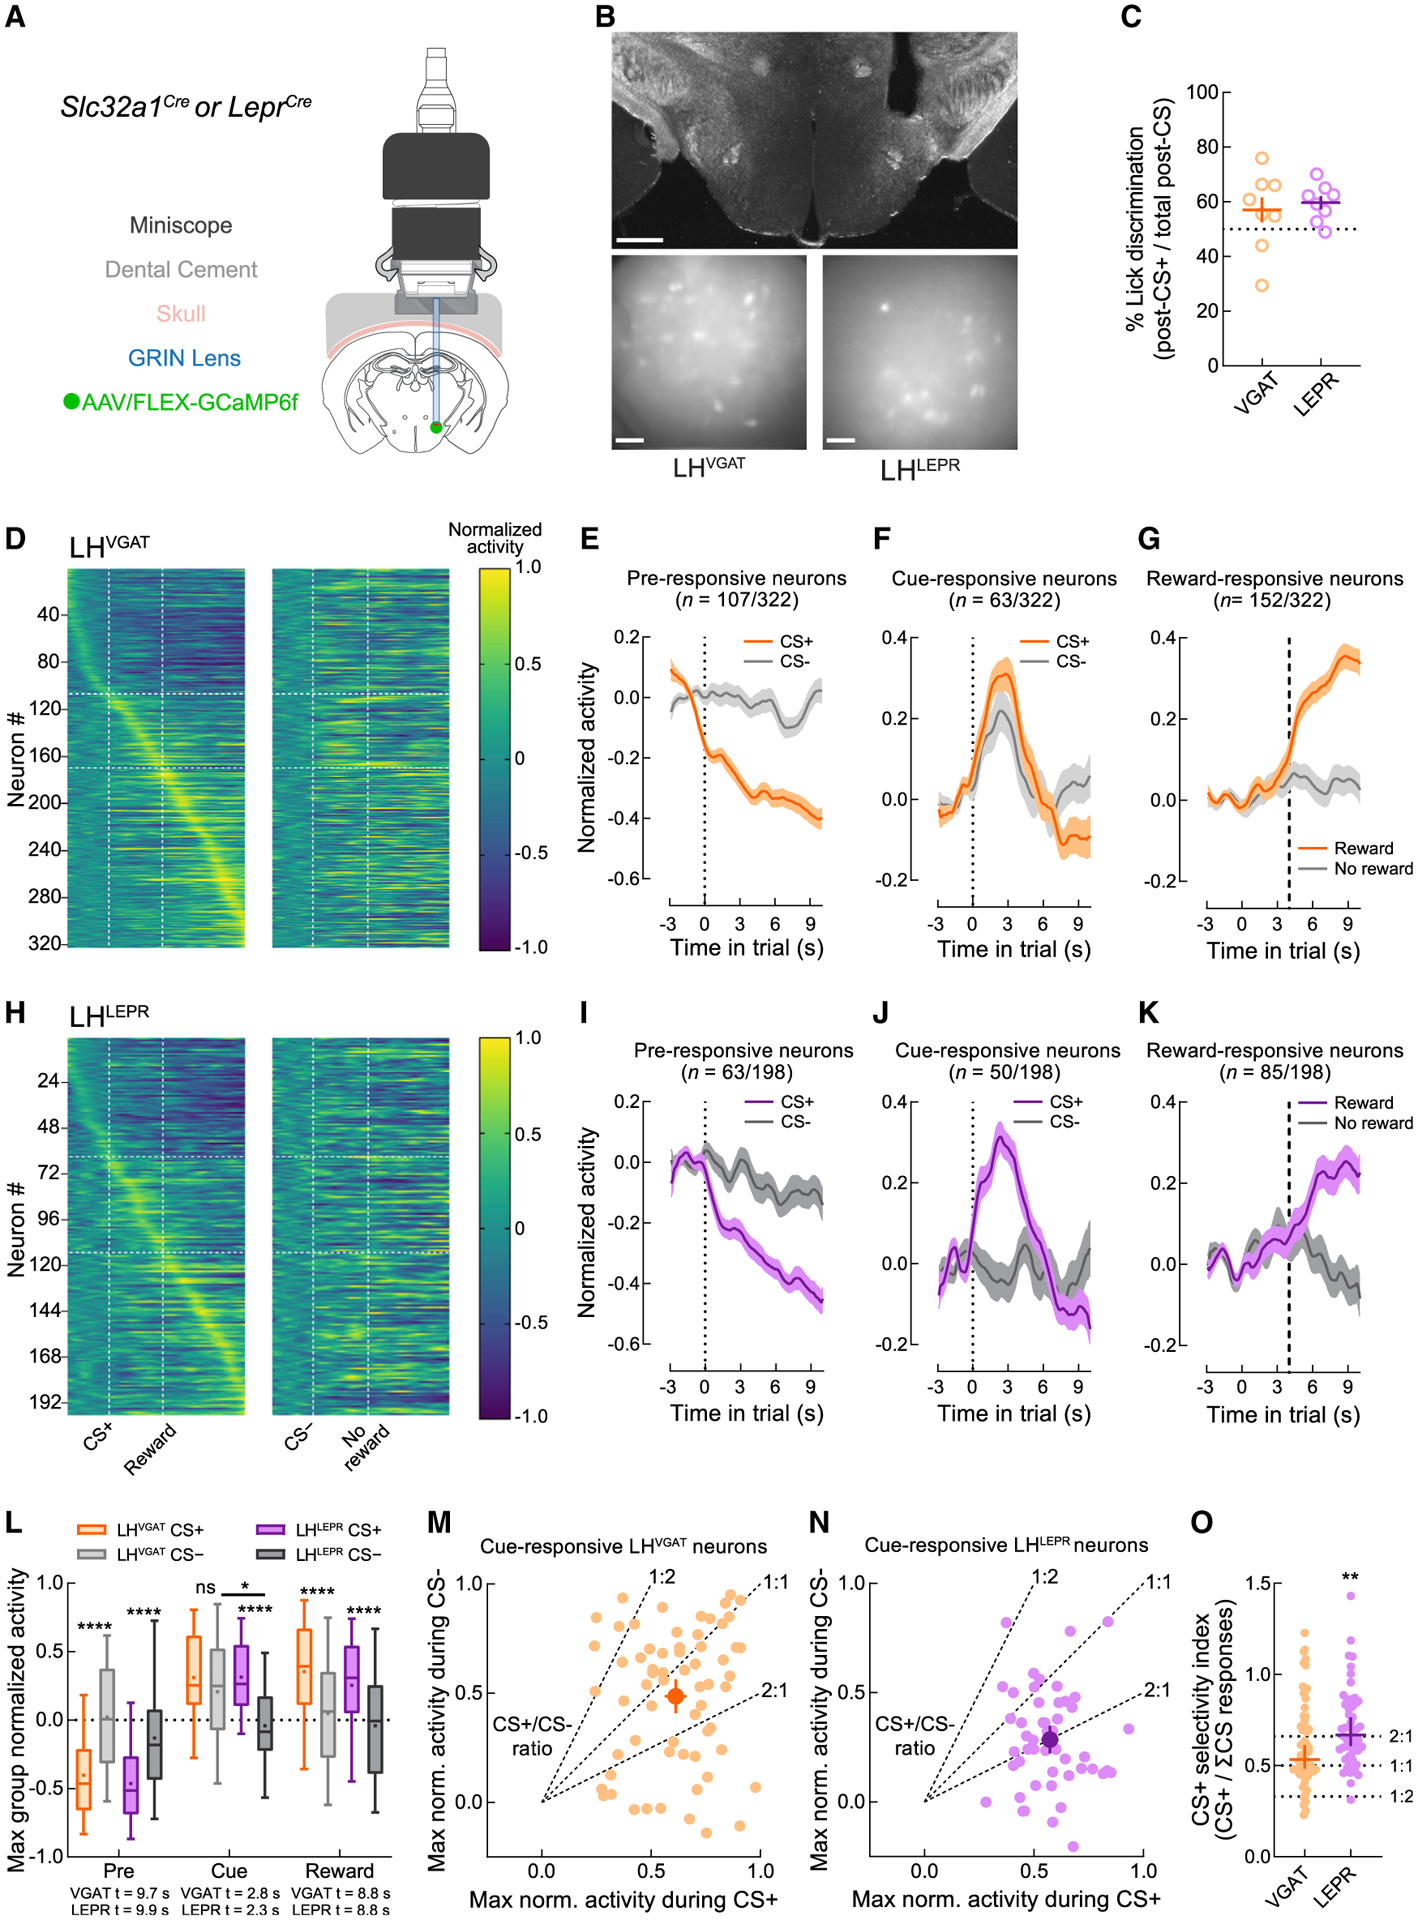
Figure 3. LHLEPR neuronal activity discriminates reward predictive from non-predictive cues.

(A) Schematic of deep brain calcium imaging.
(B) Representative images of GRIN lens placement and field of view from Slc32a1Cre and LeprCre mice. Scale bars: top, 500 μm; bottom, 100 μm.
(C) Slc32a1Cre (n = 9) and LeprCre (n = 8) mice used for functional imaging experiments on average performed most post-CS licks following CS+ trials.
(D) Normalized Ca2+ traces of individual LHVGAT neurons on CS+ or CS− trials. Vertical dashed lines indicate the beginning of the CS and outcome epochs. Horizontal dashed lines indicate groupings of neurons according to the epoch of maximal activity.
(E–G) Normalized traces of CS+ (orange) and CS− (gray) trials of (E) pre-responsive, (F) cue-responsive, and (G) reward-responsive LHVGAT neurons.
(H–K) Similar to (E)–(G), except for LHLEPR neurons.
(L) LHLEPR activity during the CS epoch discriminated trial types whereas LHVGAT activity did not. *p = 0.017, ****p < 0.0001.
(M) Maximal activity of individual LHVGAT neurons on CS+ and CS− trials, without matching the sampled time bin. Dashed lines indicate sample CS+/CS− ratios. The LHVGAT centroid ratio was 1.26, indicating slight preference for CS+ trials.
(N) Similar to (M), but for LHLEPR neurons; the centroid ratio was 2.00, indicating large preference for CS+ trials.
(O) CS+ selectivity index (CS+ response/ΣCS responses) was higher for LHLEPR than LHVGAT neurons (p = 0.0034).
Data represented as means ± SEMs.
See also Table S1 for full statistics.
