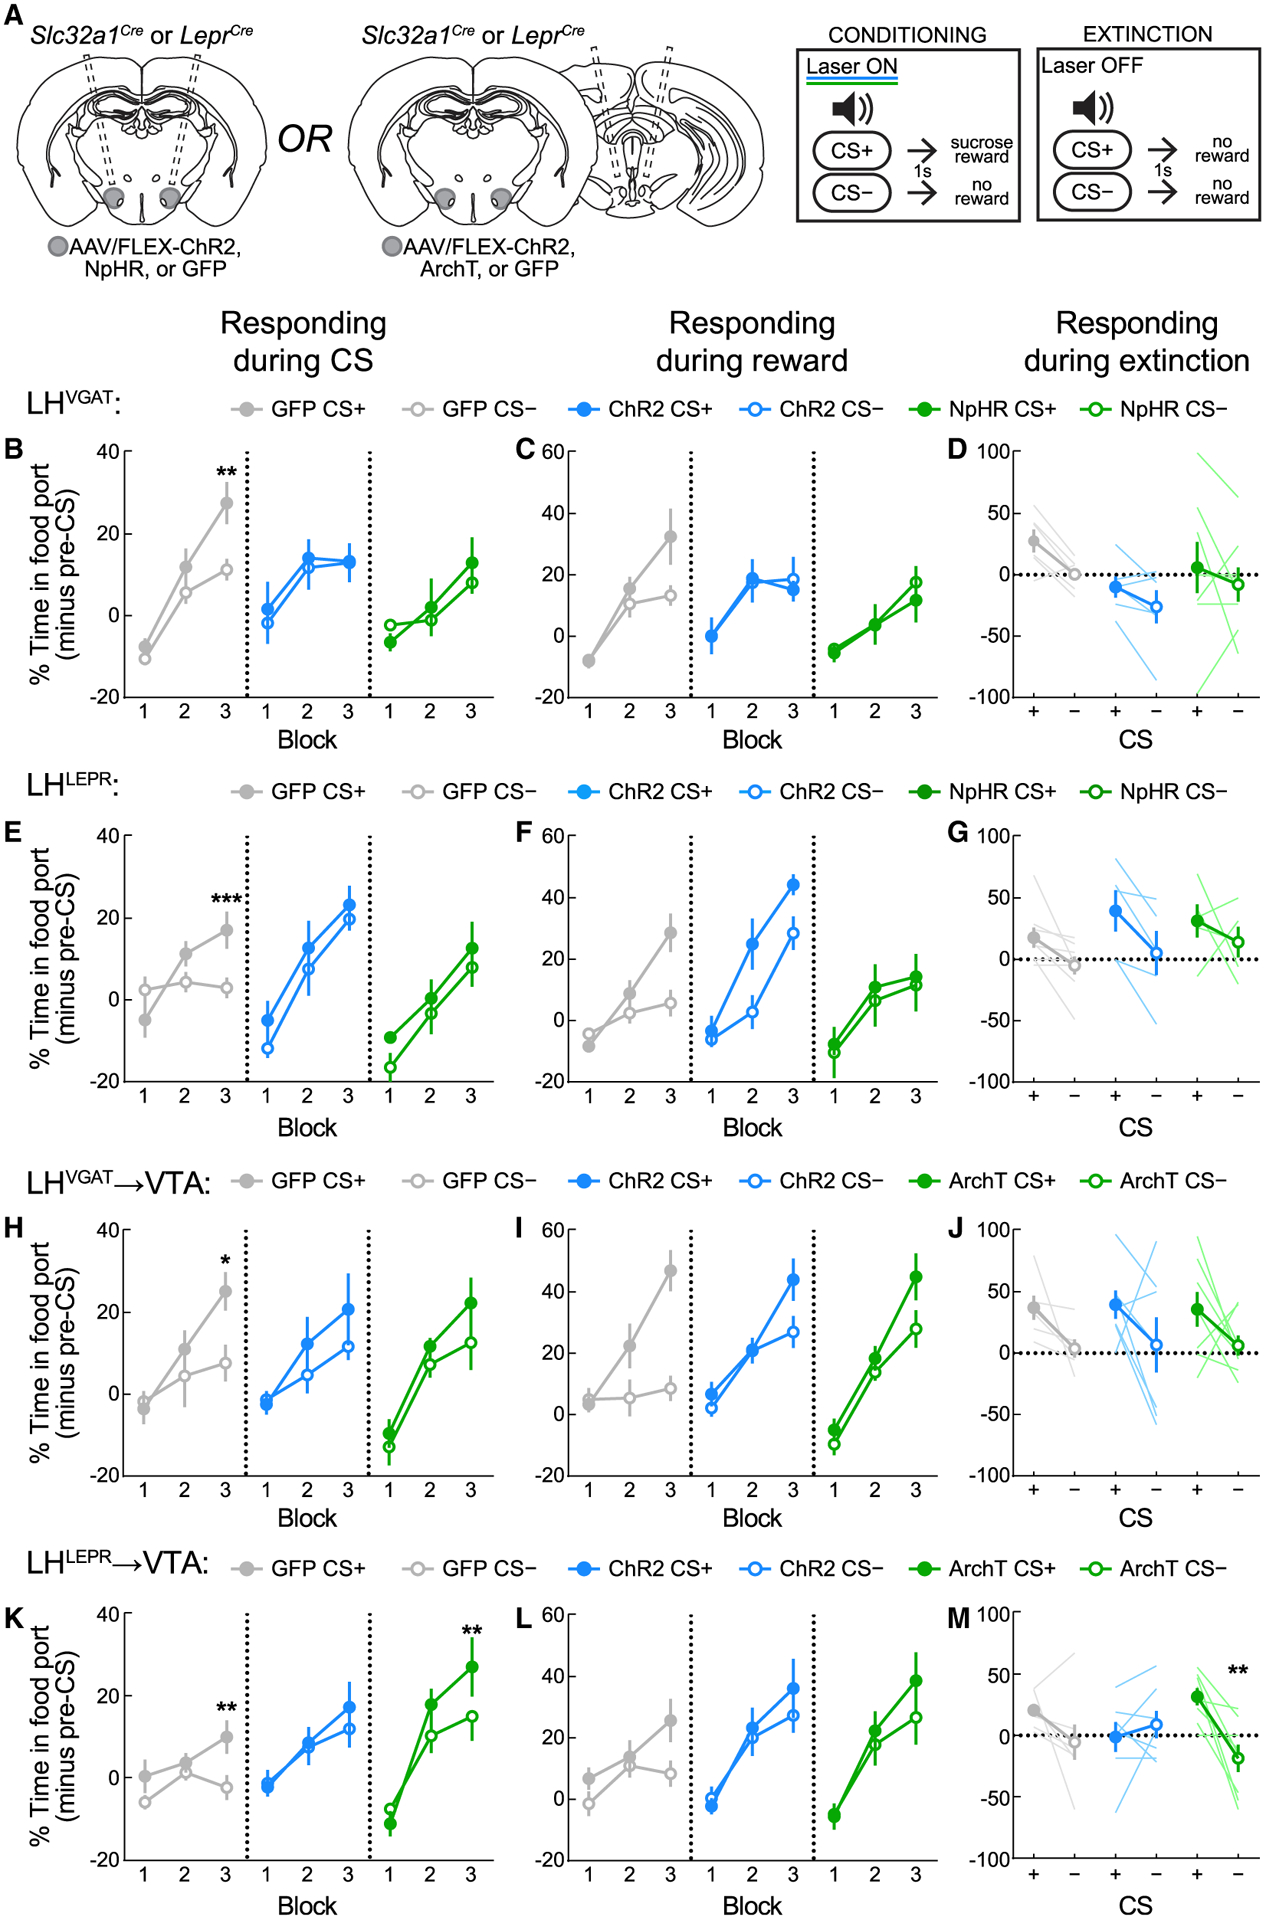
Figure 4. LHLEPR neurons mediate appetitive learning via projections to VTA circuitry.

(A) Viral injection/implant schematics and Pavlovian training and extinction protocols.
(B) Activation or inhibition of LHVGAT neurons disrupts appropriate responding. LHVGAT:GFP mice learned to discriminate CS+ from CS−. Activation of LHVGAT disrupted conditioning, as did inhibition of LHVGAT neurons. **p = 0.0021.
(C) Intact sucrose pellet collection across LHVGAT groups.
(D) Discrimination between CS+ and CS− was intact during the extinction test without optogenetic manipulation.
(E) Activation or inhibition of LHLEPR neurons disrupts appropriate responding. LHLEPR:GFP mice learned to discriminate CS+ from CS−. Activation of LHVGAT disrupted conditioning, as did inhibition of LHVGAT neurons. ***p = 0.0007.
(F) Intact sucrose pellet collection across LHLEPR groups.
(G) Discrimination between CS+ and CS− was intact during the extinction test without optogenetic manipulation.
(H) Activation or inhibition of the LHVGAT→VTA pathway attenuates Pavlovian learning. LHVGAT:GFP→VTA mice learned to discriminate CS+ from CS−. Activation of the pathway in LHVGAT:ChR2→VTA mice or inhibition of the pathway in LHVGAT:ArchT→VTA mice disrupted discrimination. *p = 0.017.
(I) Retrieval of sucrose pellets was comparable across groups.
(J) Discrimination between CS+ and CS− was intact during the extinction test without optogenetic manipulation.
(K) Inhibition of the LHLEPR→VTA pathway enhances Pavlovian learning. LHLEPR:GFP→VTA mice learned to discriminate the CS+ and CS− (*p = 0.0063). While discrimination was not apparent in LHLEPR:ChR2→VTA mice, LHLEPR:ArchT→VTA mice displayed discrimination between cues in block 3 (*p = 0.0047).
(L) Retrieval of sucrose pellets was comparable across groups.
(M) Extinction test performance was significantly affected by LHLEPR→VTA pathway manipulation during training (group × CS interaction, p = 0.017). Within-group discrimination of the CS+ and CS− was abolished in LHLEPR:ChR2→VTA mice (p > 0.99), but was increased in LHLEPR:ArchT→VTA mice (p = 0.0032) as compared to controls (p = 0.27).
Data represented as means ± SEMs; n = 5–8 mice/group.
