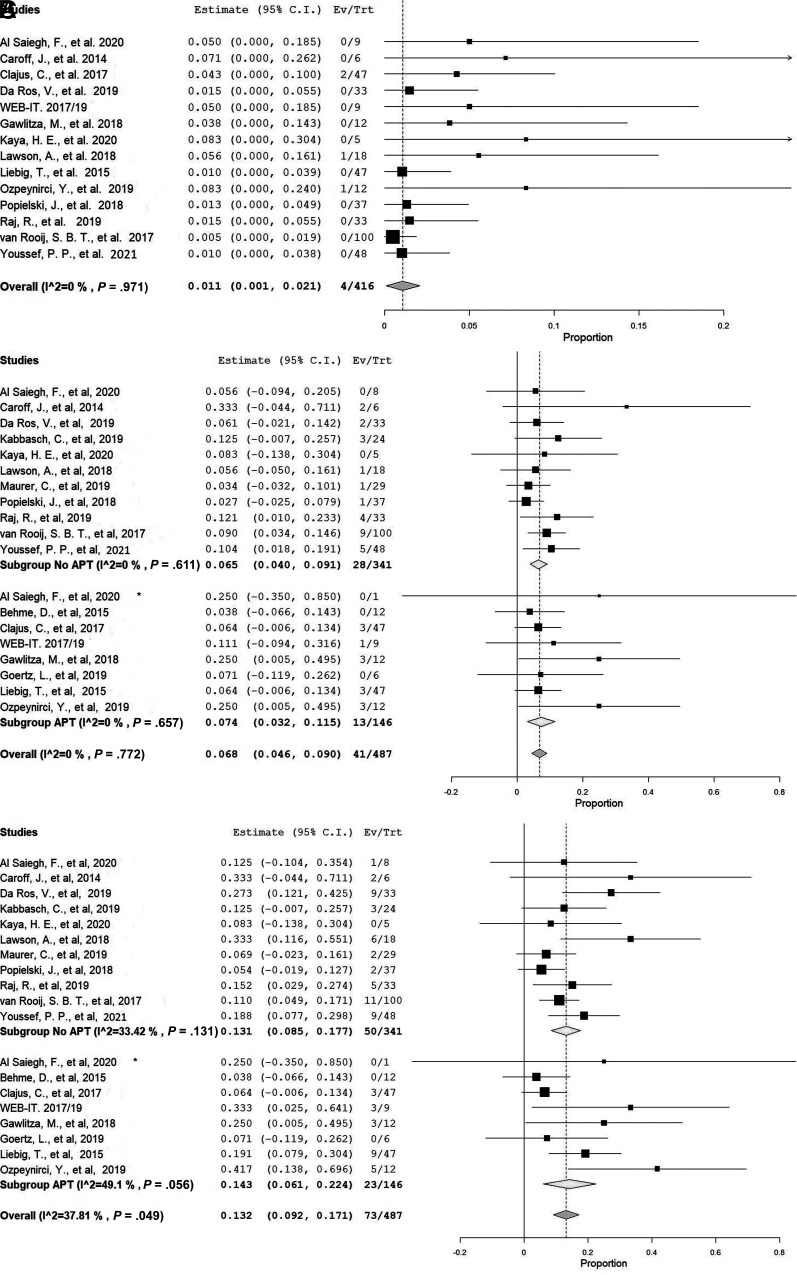
FIGURE.
A, Forest plot with a random effects model shows the late rebleeding rate. B, Forest plot with a random effects model shows the rate of treatment-related perioperative complications grouped by APT use. C, Forest plot with a random effects model shows the rate of thromboembolic complications grouped by APT use. Ev/Trt indicates Event (Outcome, complication)/Treated patient.

