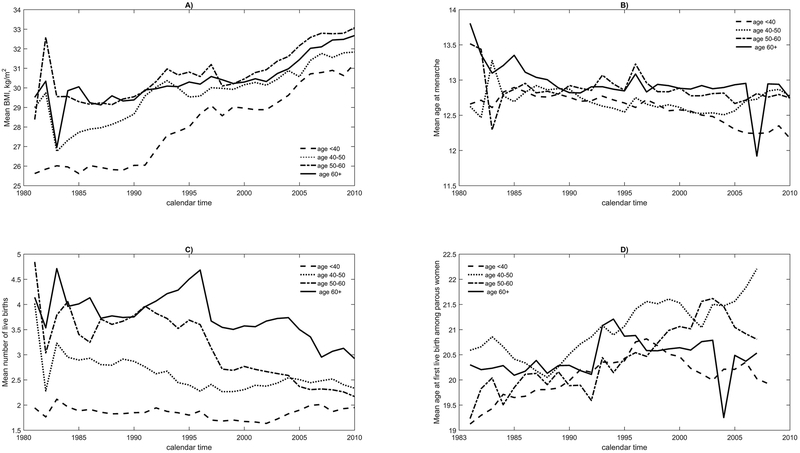
Figure 2.
Distribution of mean BMI, mean at menarche, mean number of births, mean age at first live birth among parous women from 1980 to 2008 for various age groups for black U.S. women.
Figure 2 shows the distribution of breast cancer risk factors in black U.S. women over time in 4 age groups. Panels A) through D) correspond to the distribution of BMI, age at menarche, number of live births and age at first live birth, respectively.

