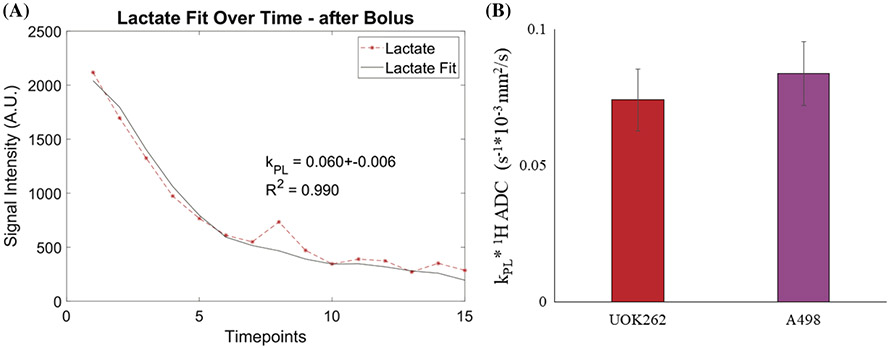
FIGURE 5.
Modeling in vivo HP signals from tumor-bearing mice. (A) Representative plot of pyruvate and lactate HP signal versus time (each timepoint = 3 s), including computed kPL values and fits of the lactate data acquired from orthotopically implanted UOK262 cells. (B) Average ± standard error for kPL * 1H ADC product for mice injected with UOK262 cells (left) and A498 cells (right)

