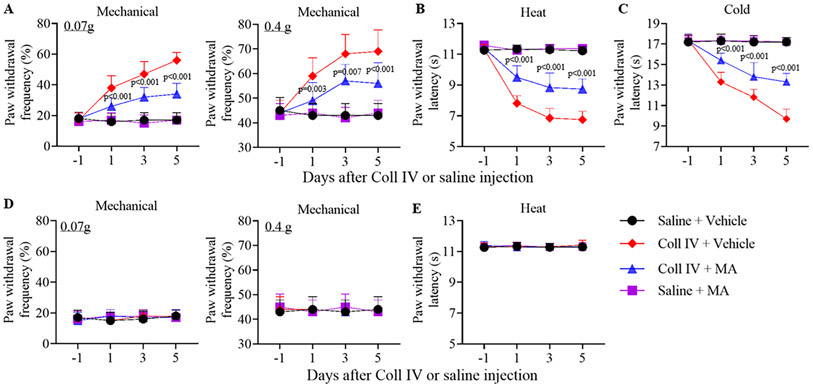
Figure 2.

Effect of intraperitoneal administration of meclofenamic acid (MA) on Coll IV microinjection-induced thalamic pain development in male mice. MA (10 mg/kg) or vehicle was given 30 min before microinjection and once daily for 5 days post-microinjection. Paw withdrawal frequencies to 0.07 g and 0.4 g von Frey filaments (A, D) and paw withdrawal latencies to heat (B, E) and cold (C) stimuli were examined on days 1, 3 and 5 after microinjection on the contralateral (A-C) and ipsilateral (D, E) sides. n = 10 mice/group. The p values on top of blue triangles indicate a difference between the vehicle and MA groups in Coll IV mice at the corresponding time points. Statistical significance was calculated with two-way ANOVA (time × treatment) with repeated measures followed by post hoc Tukey test. (A) For 0.07 g, Ftime (3, 144) = 43.958, p < 0.001; Ftreatment (3, 144) = 150.666, p < 0.001; Ftime × treatment (9, 144) = 20.398, p < 0.001. For 0.4 g, Ftime (3, 144) = 15.887, p < 0.001; Ftreatment (3, 144) = 57.782, p < 0.001; Ftime × treatment (9, 144) = 7.951, p < 0.001. (B) Ftime (3, 144) = 160.778, p < 0.001; Ftreatment (3, 144) = 419.651, p < 0.001; Ftime × treatment (9, 144) = 48.742, p < 0.001. (C) Ftime (3, 144) = 120.155, p < 0.001; Ftreatment (3, 144) = 307.617, p < 0.001; Ftime × treatment (9, 144) = 46.073, p < 0.001. (D) For 0.07 g, Ftime (3, 144) = 0.63, p = 0.597. Ftreatment (3, 144) = 0.185, p = 0.906; Ftime × treatment (9, 144) = 0.704, p = 0.705. For 0.4 g, Ftime (3, 144) = 0.0652, p = 0.978; Ftreatment (3, 144) = 0.0652, p = 0.978; Ftime × treatment (9, 144) = 0.261, p = 0.984. (E) Ftime (3, 144) = 0.373, p = 0.772. Ftreatment (3, 144) = 0.351, p = 0.788; Ftime × treatment (9, 144) = 0.568, p = 0.822.
