
Figure 4.
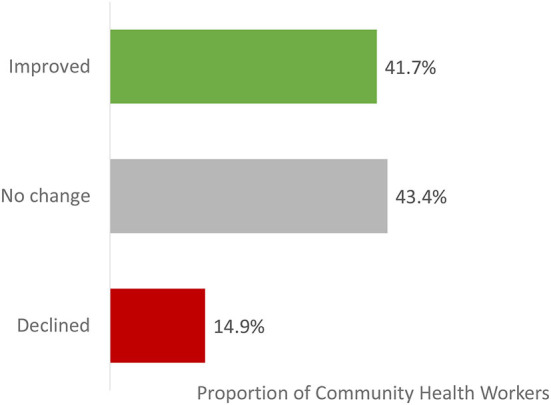
Total knowledge score at endline relative to baseline – summary of within-subjects results (intention to train population). improved: total knowledge score at endline is higher than total knowledge score at baseline. No change: total knowledge score at endline is identical to total knowledge score at baseline. Declined: total knowledge score at endline is lower than total knowledge score at baseline. The total score per participant is the total number of correct answers for the 4 knowledge questions and has a range from 0 to 4. When a participant responded “unsure” this was counted as in incorrect answer. Proportions are calculated relative to the total number of CHWs that responded to all 4 baseline and endline knowledge questions (16,856 [32·5% of the Intention To Train population]).