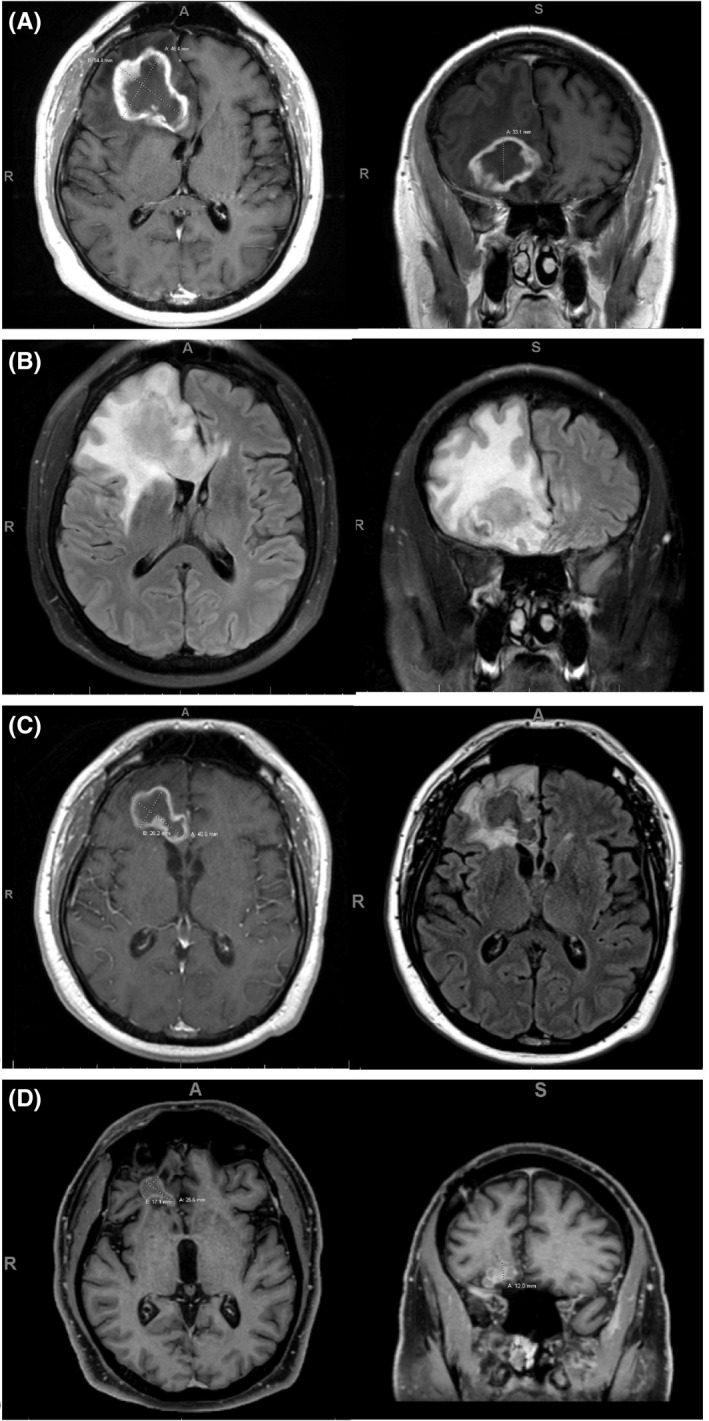
FIGURE 1.

(A) MRI brain at time of diagnosis, T1 post‐contrast axial and coronal images. (B) MRI brain at time of diagnosis, T2 FLAIR axial and coronal images. (C) MRI brain at first follow‐up 3 months after radioimmunotherapy, axial T1 post‐contrast (left) and T2 FLAIR (right) images. (D) MRI brain at last follow‐up 16 months after radioimmunotherapy, T1 post‐contrast axial (left) and coronal (right) images
